Retail at the Breaking Point STRATEGIC TRENDS ANALYSIS 2026(Part 2)

Part 1 explained why retail hit a breaking point. Part 2 explains how the winners rebuild the business model. The next three meta-forces are not “future trends” — they are the mechanisms that determine whether a retailer can fund transformation, stay compliant across markets, and protect consumer trust while expanding margin.
Meta-Force 5: Platform Economics & The Orchestration Imperative
Trend Summary
Trend Deep-Dives
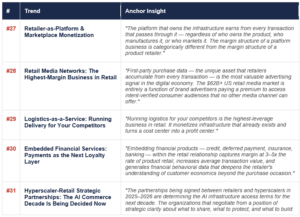
Trend #27 — Retailer-as-Platform & Marketplace Monetization

WHY THIS EXISTS
Amazon: approximately 40% of US e-commerce, 60%+ of units sold by third-party sellers (eMarketer 2025). Walmart’s continued NRF #1 ranking specifically attributed to “significant commitments to a new online marketplace and fulfilllment model.” Shopify GMV reached $292.3B in 2024. Target Plus expanding.
BUSINESS IMPACT
• Marketplace revenue (fees, advertising, data) carries higher margin than first-party product sales — the income statement transformation is structural, not incremental
• Third-party inventory expands assortment without inventory risk — the marketplace model converts working capital into fee income
• Platform data on third-party transactions provides competitive intelligence on category trends and pricing that no market research can replicate
STRATEGIC IMPLICATIONS
• Define the strategic scope of your marketplace: which categories, which seller types, what quality curation standards — the marketplace you build reflects the brand you are
• Invest in seller success tools and APIs — platform value depends on seller quality and productivity, not just seller volume
• Develop a clear platform monetization strategy: listing fees, fulfilllment fees, advertising, data licensing — the combination determines whether the marketplace is profitable or just expensive
Trend #28 — Retail Media Networks: The Highest-Margin Business in Retail
WHY THIS EXISTS
US retail media spend exceeded $62B in 2025 (eMarketer) — concentrating around Amazon Ads, Walmart Connect, and Kroger Precision Marketing. Amazon’s advertising business exceeds $50B annually at margins far higher than product retail. Walmart Connect is Walmart’s fastest-growing business segment.
BUSINESS IMPACT
• Retail media margin: 70–90% gross margin vs. 25–35% on product sales — the business economics are categorically different
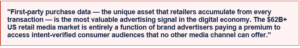
• Cookie deprecation and iOS privacy changes destroyed the precision of third-party digital advertising — brands urgently need retail’s first-party purchase data and have significant budget to access it
• Smaller retailers can participate through consortium models (Instacart Ads, CitrusAd white-label) — the opportunity is not limited to the top 5
STRATEGIC IMPLICATIONS
• Build retail media capability as a strategic profit center — not as an advertising agency function with a separate P&L that does not integrate with commercial strategy
• Invest in the first-party data infrastructure: clean customer IDs, purchase attribution, closed-loop measurement — these are the assets that make retail media valuable to brands
• Develop self-serve advertising tools that enable brands of all sizes to access your audience — not just the largest advertisers who already have access to dedicated retail media teams
Trend #29 — Logistics-as-a-Service: Running Delivery for Your Competitors

WHY THIS EXISTS
Walmart GoLocal: delivery-as-a-service for other businesses using Walmart’s last-mile network. Amazon Multi-Channel Fulfilllment: fulfillling orders for non-Amazon channels through Amazon’s logistics network. Walmart began selling its AI-powered logistics technology as SaaS to other retailers (December 2025, IT Brew). Amazon: 820M sq ft of global space generating fulfilllment revenue from competitors.
BUSINESS IMPACT
• Logistics-as-a-service converts fixed infrastructure costs into variable revenue streams — the same driver, the same route, the same warehouse now serves multiple clients
• Creates platform lock-in: retailers dependent on your logistics infrastructure have high switching costs and deepen the commercial relationship
• Competitive intelligence advantage: understanding competitor and partner fulfilllment patterns through shared infrastructure
STRATEGIC IMPLICATIONS
• Evaluate your fulfilllment network’s excess capacity — is there a logistics-as-a-service opportunity that leverages existing investment?
• Build the API interfaces that allow external clients to access your logistics infrastructure programmatically — the technology is straightforward; the commercial model is the strategic decision
• Price for volume: logistics-as-a-service reaches profitability through utilization, not unit price — the model requires scale commitment from both sides
Trend #30 — Embedded Financial Services: Payments as the Next Loyalty Layer

WHY THIS EXISTS
Walmart Money (checking accounts, money transfers, bill pay). Amazon Pay expanding to third-party checkout. Jio Finance integrated for 480M+ subscribers. Fanatics launching a credit card (announced NRF 2026). BNPL (Klarna, Affirm, Afterpay) processing hundreds of billions annually.
BUSINESS IMPACT
• Financial services carry 3–5x the margin of product retail — the income statement impact of embedding financial products is structural
• Embedded BNPL increases average order value by 20–30% — and shifts the credit risk to the BNPL provider while the retailer captures the incremental revenue
• Retail credit card holders spend 2–3x more with the issuing retailer than non-cardholders — the financial product is the most powerful loyalty mechanism available
STRATEGIC IMPLICATIONS
• Define your financial services strategy: which products align with your customer’s financial needs — and which would be credible coming from your brand?
• Build or partner on embedded payment infrastructure to reduce friction at checkout while deepening the financial relationship — the goal is both conversion improvement and relationship deepening
• Ensure financial product design aligns with customer value — regulatory scrutiny of predatory BNPL practices is intensifying and brand damage from financial mis-selling is severe
Trend #31 — Hyperscaler-Retail Strategic Partnerships: The AI Commerce Decade Is Being Decided Now

WHY THIS EXISTS
Walmart + Google: UCP co-development, Walmart products available through Gemini, Wing drone delivery expanded to 160 US locations. Jio + Meta (WhatsApp commerce) + Google (Cloud/AI investment). Microsoft Copilot + UCP integration: embedded retail checkout within Copilot. Amazon + AWS: AWS powers retail infrastructure for competitors while Amazon benefits from data and revenue.
BUSINESS IMPACT
• Partnership defines AI infrastructure access — retailers outside these partnerships will integrate into someone else’s infrastructure on less favorable terms
• Data sharing creates compounding advantages: the more behavioral and transactional data shared with an AI system, the smarter the recommendations, the higher the conversion
• The wrong partnership creates dependency: Vodafone’s deep Microsoft dependence in telecom is the cautionary tale — retail equivalents will become apparent as the partnerships mature
STRATEGIC IMPLICATIONS
• Develop an explicit hyperscaler strategy: where to partner for scale, where to compete for differentiation, and where to defend for sovereignty
• Protect the control points that must remain retailer-owned: customer relationship, first-party data, pricing authority, brand identity — these are the non-negotiables in any partnership negotiation
• Evaluate UCP adoption as the foundational partnership decision — it positions you for every AI agent deployment that follows, and late integration will be on less favorable terms
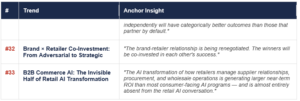
Trend #32 — Brand × Retailer Co-Investment: From Adversarial to Strategic

WHY THIS EXISTS
Target’s exclusive brand portfolio: exclusive designs and collections that exist only at Target, creating assortment no other retailer can replicate. Dick’s Sporting Goods’ acquisition of Foot Locker (referenced NRF 2026) is a vertical integration play that deepens the brand-retailer relationship. Shopify NRF 2026: retailers that build “smarter ecosystems strengthen speed to market.”
BUSINESS IMPACT
• Exclusive brand development creates product differentiation that commodity marketplace competition cannot replicate — the brands and products that exist only at your retailer are the strongest loyalty drivers available
• Shared first-party consumer data enables brands to develop products aligned with actual consumer behavior — brands will pay for this insight, creating a data monetization opportunity
• Co-investment reduces the adversarial dynamic that drives brand pull-back to DTC — the brand that is profitable through a retailer does not need to build its own channel
STRATEGIC IMPLICATIONS
• Identify the 5–10 brand relationships where co-investment creates genuine mutual advantage — start with brands in the highest pull-back risk categories
• Offer first-party consumer data sharing as a value proposition — brands will pay for insight into their actual end customers that market research cannot deliver
• Develop exclusive product capability: the ability to co-create with brands requires investment in design, product development, and supply chain partnership — it cannot be improvised
Trend #33 — B2B Commerce AI: The Invisible Half of Retail AI Transformation

WHY THIS EXISTS
Every retailer manages billions of dollars in procurement, supplier relationships, contract negotiations, and wholesale. The AI transformation of this layer is enormous and largely invisible in retail AI trend coverage. Satya Nadella and Microsoft have been explicit: AI’s first and most measurable enterprise impact is on the corporate workforce — how buyers make decisions, how finance operates, how legal processes contracts, how supply chain teams manage supplier performance. Walmart’s Marty (supplier super-agent) automates procurement and inventory optimization at scale. AI-powered contract review (identifying unfavorable terms, benchmarking against industry standards) is reducing legal cost and risk in retail procurement. AI-driven supplier performance scoring is replacing manual audits. Autonomous supply chain decision-making — AI agents automatically adjusting purchase orders based on demand signals, inventory levels, and supplier lead times without human intervention — is the next major frontier in B2B retail AI. Per 2026 analyst consensus: “The use of AI and agents in B2B for retailers will be in the form of autonomous supply chain decision-making.” Microsoft Dynamics 365 and LinkedIn are reshaping how procurement teams manage supplier relationships and market intelligence. This is not a future trend — it is happening in the procurement organizations of leading retailers now and generating documented ROI.
BUSINESS IMPACT
• AI-powered procurement automation (RFP processing, contract review, purchase order generation) is reducing procurement operating costs by 20-40% in early deployments — larger near-term ROI than most consumer-facing AI programs
• Autonomous supply chain decision-making — AI agents adjusting purchase orders, rerouting inventory, and managing supplier performance without human approval — is compressing supply chain response times from weeks to hours
• Supplier intelligence AI (synthesizing news, financial signals, ESG data, and performance history into real-time supplier risk scores) is replacing the quarterly supplier review process with continuous monitoring — directly reducing supply chain disruption risk
• The B2B commerce AI layer is the foundation of the agentic commerce vision: if AI agents handle the consumer-facing purchase on one end, autonomous supply chain AI must handle the corresponding procurement and fulfillment decisions on the other end for the model to be commercially viable
STRATEGIC IMPLICATIONS
• Audit the procurement and supplier management processes for AI automation opportunity — contract review, purchase order generation, supplier performance scoring, and demand signal sharing with suppliers are the highest-value entry points
• Build the supplier data infrastructure required for AI-powered procurement: real-time supplier performance data, contract terms in machine-readable format, and supplier risk signals from external sources in a unified supplier intelligence platform
• Define the human-AI boundary in procurement decisions explicitly: which purchase orders can AI execute autonomously, which require human approval, and which require board-level sign-off — the boundary definition is the governance framework
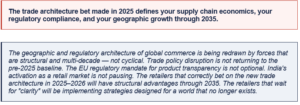
Meta-Force 6: The Geopolitics of Commerce — Trade Architecture, Sovereignty & the New Growth Markets
Trend Summary
Trend Deep-Dives
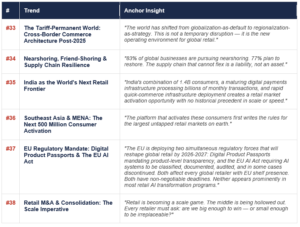
Trend #33 — The Tariff-Permanent World: Cross-Border Commerce Architecture Post-2025

WHY THIS EXISTS
The cross-border duty exemption exemption ended August 29, 2025. A July 2025 bill will end cross-border duty exemption for ALL countries by 2027. US tariffs on Chinese imports reached up to 145%. Deloitte Global Retail Outlook 2026: 95% of retail executives expect global trade policies to push costs higher — with many moving beyond small adjustments to structural supply chain redesign. PwC: US tariff measures affecting TMT supply chains potentially rising from $76B to $697B. HSBC Global Trade Pulse 2025: 83% of global businesses pursuing nearshoring; 77% plan to reshore.
BUSINESS IMPACT
• Cross-border DTC models built on duty-free small parcel shipping face permanent structural cost disadvantage — requiring US inventory, higher prices, or both
• Retailers that began nearshoring in 2022–2023 have a 2–3 year operational head start over those reacting in 2025 — the advantage compounds as they optimize their nearshored supply chains
• Tariff classification has become a core strategic capability — AI-powered tariff intelligence (automating customs classification, identifying misclassification risk) is reducing compliance cost and audit risk
STRATEGIC IMPLICATIONS
• Map supply chain tariff exposure by SKU, by country of origin, and by trade classification — the product-level tariff model is the foundation of the supply chain redesign decision
• Develop a nearshoring roadmap starting with highest-volume, highest-tariff-risk categories — Mexico USMCA, Vietnam, and India are the primary nearshoring destinations for US retail in the current environment
• Treat tariff classification accuracy as a commercial asset: AI-powered customs intelligence reduces misclassification errors, speeds clearance, and reduces audit exposure
Trend #34 — Nearshoring, Friend-Shoring & Supply Chain Resilience

WHY THIS EXISTS
HSBC Global Trade Pulse 2025: 83% of global businesses pursuing nearshoring; 77% plan to reshore as part of broader supply chain reconfiguration. Schwarz Group (Lidl/Kaufland) is specifically strengthening European supply chains. Companies integrating SAP integrated business planning report double-digit improvements in forecast accuracy. Deloitte: integrating robotic process automation across logistics and procurement significantly reduces manual effort.
BUSINESS IMPACT
• Nearshored supply chains reduce tariff exposure and lead times but increase per-unit production costs 15–30% — the economics require higher domestic price realization or operational efficiency to close the gap
• Supply chain diversification reduces catastrophic concentration risk — COVID-19 and tariff shocks demonstrated at scale that single-source dependency is an existential business risk
• Retailers with diversified supply chains have demonstrably better crisis response capability — they can redirect sourcing when a single-country supply is disrupted
STRATEGIC IMPLICATIONS
• Build supplier diversification into procurement policy: no single country should represent more than 40–50% of any critical category — enforce this as a procurement standard, not a guideline
• Evaluate Mexico USMCA advantages for US-serving supply chains: geographic proximity, USMCA cost structures, and manufacturing infrastructure make Mexico the primary nearshoring destination for US retail in most categories
• Develop supply chain resilience scoring: assess each supplier and geography against tariff risk, geopolitical risk, logistics reliability, and quality — and use this to prioritize diversification investments
Trend #35 — India as the World’s Next Retail Frontier

WHY THIS EXISTS
India’s e-commerce market projected to reach $200B by 2026. JioMart: 200% YoY daily order growth, 600+ dark stores, 5,000 pin codes, 1,000+ cities (Reliance Retail earnings, October 2025). Reliance Retail: 18,000+ stores, 400M+ registered customers, IPO planned at approximately $200B valuation in 2027. Myntra: 200M annual active users — 50% GenZ. UPI processes billions of transactions monthly.
BUSINESS IMPACT
• 1.4B consumers, rapidly rising middle class, and world-leading digital payments infrastructure (UPI) creating the largest single retail growth opportunity in the world
• Quick commerce model is more advanced in India than anywhere else — JioMart’s 30-minute delivery across 1,000+ cities is leapfrogging developed market retail in speed and scale
• Amazon, Flipkart (Walmart-owned), and Jio are in a three-way battle for India — the outcome will define the world’s largest retail market for two decades
STRATEGIC IMPLICATIONS
• For global retailers: India is not optional — define your India market entry or partnership strategy now, or cede the market to Jio, Amazon India, and Flipkart
• Develop India-specific product, pricing, and supply chain strategies — the Indian consumer is not a cheaper version of a Western or Chinese consumer; the needs, price sensitivity, and channel preferences are structurally different
Study JioMart’s O2O model: integrating 3,000+ physical retail stores as dark store nodes is the playbook for omnichannel in emerging markets with existing retail density
Trend #36 — Southeast Asia & MENA: The Next 500 Million Consumer Activation

WHY THIS EXISTS
NRF 2026: Big Show announcing global expansion with new event in Riyadh — the Middle East is reaching retail scale. Lulu Group in the NRF Top 50. GCC nations investing heavily in AI-ready infrastructure and digital commerce with government mandates and public funding. Malls in MENA, Latin America, and Asia expanded in 2024 with lifestyle, food services, and entertainment formats. US tariff tensions are accelerating regional demand for non-US, non-Chinese platform alternatives.
BUSINESS IMPACT
• Southeast Asia’s combined GDP and consumer base rivals India in e-commerce growth potential — and the market is less contested than India
• MENA sovereign wealth and government-backed digital infrastructure programs create retail investment environments unlike anywhere else — with government guarantees and public co-investment
• Regional platform winners will have network effects that make entry prohibitively expensive for latecomers — the window to establish position is open now and will close within 3–5 years
STRATEGIC IMPLICATIONS
• Evaluate Southeast Asia and MENA as strategic markets with dedicated resource allocation — not as afterthoughts to US and European growth plans
• Study the platform models that are winning in each market: Grab’s super-app model in SEA, Noon’s marketplace model in MENA, Talabat’s delivery-first expansion — the winning models differ by market
• Build regional supply chain and logistics capability before market entry: Western-designed fulfilllment models rarely transfer directly to markets with different infrastructure, geography, and consumer expectations
Trend #37 — EU Regulatory Mandate: Digital Product Passports & The EU AI Act

WHY THIS EXISTS
EU Ecodesign for Sustainable Products Regulation creates Digital Product Passports — mandatory digital records containing product sustainability, repairability, recyclability, and supply chain transparency data. GS1 “Sunrise 2027”: all POS systems worldwide must scan 2D barcodes by end-2027. The EU is the world’s largest single market — non-compliance is not a viable strategy for any global retailer.
BUSINESS IMPACT
• DPP compliance requires end-to-end supply chain data visibility that most retailers do not currently possess — the audit of current state is the first step to understanding the gap
• Brands without supply chain transparency infrastructure face loss of EU shelf access — the regulatory timeline is non-negotiable and the implementation complexity is significant
• DPP infrastructure, once built for compliance, generates recommerce, product authenticity verification, and sustainability marketing as commercial assets
STRATEGIC IMPLICATIONS
• Audit current supply chain data completeness against DPP requirements — identify the specific gaps, the suppliers responsible for them, and the remediation timeline
• Integrate DPP compliance into the GS1 2D barcode migration program (Trend 16) — build once, use for both compliance and commercial purposes
• Treat DPP as a commercial asset, not just a compliance cost: product transparency is a genuine differentiator for GenZ consumers and a prerequisite for EU market access
Trend #38 — Retail M&A & Consolidation: The Scale Imperative

WHY THIS EXISTS
Deloitte: 55% of consumer products executives agree 2026 will be a bigger-than-normal year for acquisitions. Aldi acquired Winn-Dixie/Harvey’s stores. Dick’s acquiring Foot Locker (NRF 2026). McKinsey: consolidation creates synergies of 15%+ capex and 30%+ opex. NRF Top 10 has not changed for multiple consecutive years — power concentrating at the top.
BUSINESS IMPACT
• Scale creates the AI and data infrastructure investment capacity that subscale operators cannot fund independently — the technology investment required to compete is becoming a scale barrier
• In-category consolidation reduces competitive intensity and improves pricing power — the regulatory environment is approving more deals as governments recognize the need for domestic retail scale to compete with Chinese platforms
• The retailers that fail to achieve scale in their core market become acquisition targets — being acquired by a platform retailer at scale is not the worst outcome, but it is not a strategy
STRATEGIC IMPLICATIONS
• Develop an explicit M&A thesis: which acquisitions create scale in core markets, which create capability in adjacent areas, and which defend against competitive disruption?
• Evaluate consolidation opportunities in your core market before competitors do — the best consolidation targets are typically obvious to everyone; the question is who moves first
• Build integration capability in advance: M&A value is destroyed in integration, not in deal execution — the retailers with proven integration playbooks move faster and capture more synergy
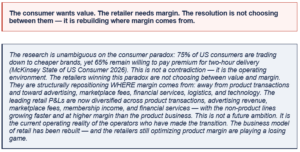
Meta-Force 7: The Value-Margin Paradox — Look Cheap to the Consumer, Earn Like a Tech Company
Trend Summary
Trend Deep-Dives
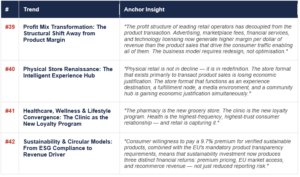
Trend #39 — Profit Mix Transformation: The Structural Shift Away from Product Margin

WHY THIS EXISTS
Walmart Investor Day (April 2025): “Reshaping its profit mix allows the company to invest in lower prices for customers while growing profit faster than sales.” Amazon’s advertising business exceeded $50B annually at margins far above product retail. Walmart Connect reached $6.4B in global advertising revenue in FY2025, growing 46% year-over-year — making it Walmart’s fastest-growing business segment. Retail media exceeded $62B in total US spend in 2025.
BUSINESS IMPACT
• Retailers that transform profit mix can simultaneously lower product prices and improve total margin — this is not a trade-off, it is a business model transformation
• High-margin revenue lines fund the price investments needed to compete with Aldi, Costco, and factory-to-consumer models — this is the Walmart reinforcing cycle: lower prices drive more traffic, more traffic drives more advertising value
• Retailers stuck in product-margin-only models face structural disadvantage vs. platform-model competitors — and the gap is compounding, not stable
STRATEGIC IMPLICATIONS
• Audit current profit mix: what percentage comes from product margin vs. services, advertising, and fees? The answer drives the strategic agenda
• Develop the three non-product profit centers accessible at your scale: retail media network, marketplace fees, and embedded financial services — these are the building blocks of the new retail P&L
Make profit mix transformation an executive KPI with board visibility — not just total margin, but the composition of that margin and the trajectory toward tech-company economics.
Trend #40 — Physical Store Renaissance: The Intelligent Experience Hub

WHY THIS EXISTS
NRF 2026 consensus: physical stores are regaining importance. Dick’s House of Sport: climbing walls, batting cages, party spaces, community events — every space designed with the “athlete” (consumer) in mind. Mall foot traffic H1 2025: up 1.8%, visit duration up 3.3% (Capital One Shopping). Payplug NRF 2026: “The store as a Third Place — a living space between home and work where service makes the visit worthwhile.”
BUSINESS IMPACT
• Experiential retail drives higher basket sizes, longer dwell times, and stronger brand loyalty than transactional formats — the economics of experience are better than the economics of transaction
• Physical stores serving as fulfilllment nodes, media environments, and experience destinations earn multiple revenue streams from a single footprint — the store becomes multi-purpose infrastructure
• Arc’teryx in-store repair workshops demonstrate the store as long-term brand commitment — creating loyalty that no discount program or loyalty points system can replicate
STRATEGIC IMPLICATIONS
• Redesign store format strategy around purpose: what does each store format deliver beyond product transaction? Every store should have an explicit answer to this question
• Invest in experience and service elements that online cannot replicate: human expertise, physical product interaction, community, immediacy, and sensory engagement
• Measure stores on total economic contribution: direct sales + fulfilllment value + media value + customer lifetime value impact — not just sales per square foot
Trend #41 — Healthcare, Wellness & Lifestyle Convergence: The Clinic as the New Loyalty Program

WHY THIS EXISTS
Amazon CEO Andy Jassy (2025 earnings): Amazon has become a go-to grocery and healthcare destination for over 150 million Americans. CVS + Aetna: integrated health-insurance-pharmacy model. Petco’s veterinary services model (referenced NRF 2026): serving pet owners integratedally rather than selling products. Walmart Health centers and MinuteClinics.
BUSINESS IMPACT
• Health and wellness is the highest-frequency consumer interaction — creating loyalty and data depth that product retail cannot match
• Healthcare retail convergence creates high-margin revenue lines: clinical services, prescription management, health monitoring products — with a consumer trust level that product categories cannot achieve
• Amazon entering healthcare is an existential threat to pharmacy retail — Amazon Pharmacy positioned Amazon as healthcare infrastructure for 150M+ Americans in a single strategic move
STRATEGIC IMPLICATIONS
• Evaluate healthcare and wellness as a strategic expansion category — the question is which health services your format can credibly deliver, not whether to expand into health at all
• Study the Petco model: identify the high-frequency need in your category and build service infrastructure around it — the product becomes the entry point, the service becomes the relationship
• Build health data infrastructure carefully — health data is regulated, sensitive, and enormously valuable; the architecture must be designed for regulatory compliance from day one
Trend #42 — Sustainability & Circular Models: From ESG Compliance to Revenue Driver
WHY THIS EXISTS
Consumers willing to pay 9.7% more for sustainable products (Zappi 2026 survey). 6 in 10 GenZ consumers cite concern about climate change as a major factor in purchase decisions. EU Ecodesign Regulation and Digital Product Passports are creating mandatory forcing functions. Resale growing 11x faster than traditional retail.
BUSINESS IMPACT
• Sustainable product premiums capture consumer willingness to pay above commodity pricing — the price premium is documented, measurable, and growing
• Recommerce integration converts sustainability commitment into incremental revenue stream — Patagonia, Lululemon, and REI have all demonstrated this commercially
• EU DPP compliance is inseparable from sustainability strategy — the infrastructure built for regulatory compliance simultaneously enables recommerce, sustainability marketing, and consumer transparency
STRATEGIC IMPLICATIONS
• Develop a sustainability-as-revenue strategy, not a sustainability-as-cost strategy — the framing determines the organizational investment level and the commercial ambition
• Build recommerce into the product lifecycle from design: products designed for repairability and resale are more valuable circular assets — this requires brief manufacturers and suppliers on the commercial rationale
• Communicate sustainability credentials specifically and verifiably — GenZ consumers are highly sophisticated about greenwashing and the brand damage from perceived inauthenticity is severe and lasting
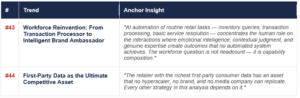
Trend #43 — Workforce Reinvention: From Transaction Processor to Intelligent Brand Ambassador

WHY THIS EXISTS
Gartner: organizations will replace 20–30% of service agents with generative AI by 2026 — and simultaneously create new roles to manage and optimize AI systems. Deloitte 2026 Retail Outlook explicitly flags immigration policy and labor shortages as key risk factors. NRF 2026 workforce expert: “Retailers will continue offering individualized, generous employment packages to attract a workforce expecting increased flexibility.” MHI/Deloitte 2025: 83% of supply chain organizations using robotics within five years.
BUSINESS IMPACT
• Associates empowered by AI tools deliver measurably higher NPS, basket size, and conversion rates — the business case for associate empowerment is commercial, not just cultural
• Labor cost efficiency improves when AI handles routine tasks (inventory checking, price lookup, basic queries) and humans handle high-value interactions — the cost-per-interaction economics are significant
• Workforce retention improves when roles are meaningful — the associate who delivers exceptional personalized service has a more fulfillling role than the one processing transactions, and the labor market is responding
STRATEGIC IMPLICATIONS
• Redesign associate roles around capabilities AI cannot replicate: empathy, judgment, expertise, relationship, and brand representation — these are the durable skills in a world where AI handles the routine
• Invest in associate training for AI tool usage — the skill gap is as real in retail as in any other sector, and retailers that close it first will have a productivity advantage
• Build workforce flexibility into scheduling and role design — GenZ and Millennial workers expect more autonomy and will change employers to get it; the retailers that design for flexibility will attract better associates
Trend #44 — First-Party Data as the Ultimate Competitive Asset

WHY THIS EXISTS
Privacy regulations (GDPR, CCPA, evolving state laws) are eliminating third-party data. iOS privacy changes destroyed the precision of third-party digital advertising. Retail media’s $62B+ market exists specifically because first-party purchase data is the most valuable advertising signal available. 71% of consumers expect personalized retail experiences (Zappi). The first-party data advantage compounds over time — it gets better with every transaction.
BUSINESS IMPACT
• First-party data enables every other trend in this analysis: personalization (Trend 8), retail media (Trend 28), AI super-agents (Trend 2), predictive demand intelligence (Trend 14) — it is the foundation beneath every strategic initiative
• Data clean rooms enable privacy-safe collaboration between retailers and brand partners without exposing raw consumer data — creating a new class of commercial relationships based on shared intelligence
• Retailers that do not invest in first-party data infrastructure are building on sand — every AI initiative and every retail media business depends on it, and the cost of retroactive remediation is far higher than proactive architecture
STRATEGIC IMPLICATIONS
• Build a unified first-party data platform: customer identity, purchase history, behavioral signals, and real-time event streams in a single governed infrastructure — this is the most important infrastructure investment a retailer can make in 2026
• Develop data clean room capability for brand and advertising partner collaboration — this is the commercial infrastructure that makes retail media valuable to sophisticated brand partners
• Design the consent and privacy architecture first — the regulatory environment for consumer data is tightening globally, and the cost of retroactive compliance is far higher than proactive design
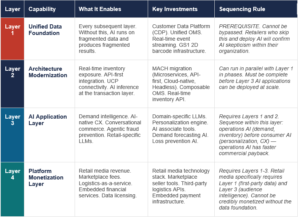
Investment Sequencing: The Mandatory Build Order and Why the Layers Cannot Be Skipped

The most common failure mode in retail AI transformation is not a technology failure. It is a sequencing failure: investing in Layer 3 capabilities before Layer 1 and Layer 2 are operational. The result is AI that is technically sound and commercially ineffective
The Four-Layer Build Sequence: A Framework for Sequencing AI Investment in Retail

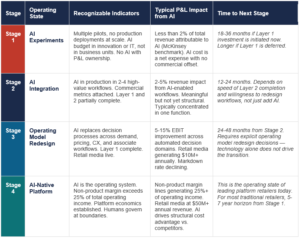
AI Maturity Model: Where Are You Starting From?
Before sequencing investment, each organization must self-assess its current maturity level. The four stages are not aspirational — they are observable operating states, each with specific indicators.

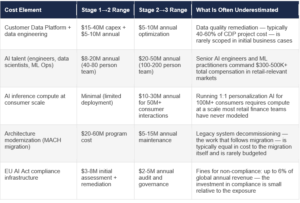
The AI Infrastructure Cost Constraint: What the Maturity Model Does Not Show
The maturity model describes stages and timelines. It does not price the transition. The following cost elements are material and absent from most retail AI transformation business cases:

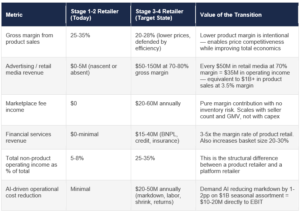
Profit Mix Transformation: What Stage 3 and 4 Look Like in P&L Terms
The principle that platform economics generate higher margin than product transactions is widely stated. The following illustrative model makes the structural difference concrete for a $5B revenue retailer.

7 Anti-Patterns: The Organizational Failure Modes That Consistently Destroy AI Value
Anti-patterns are not mistakes made by incompetent leaders. They are the patterns that emerge from rational decisions made within dysfunctional incentive structures, incomplete information, and organizational dynamics that systematically under-invest in the right things. Understanding the root cause is as important as identifying the pattern.
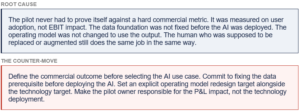
AP1: “Pilot Everywhere, Scale Nowhere”
HOW IT MANIFESTS ORGANIZATIONALLY
AI transformation programs with many pilots and no production deployments. Each pilot team has a budget, a dashboard, and a compelling demo. None have a P&L line.
THE EVIDENCE
McKinsey (January 2026): AI drives less than 2% of total revenues for more than half of operators that have tested AI use cases — despite years of piloting. The cause is consistent across organizations: no data foundation fix, no operating model change, no cross-functional ownership of outcomes, no mandate to redesign the workflow rather than just add AI on top of it. Organizations that redesigned workflows around GenAI (rather than just overlaying tools) reported significantly higher revenue impact.
A SPECIFIC EXAMPLE
A retailer runs 40 AI pilots across personalization, demand forecasting, supply chain, and customer service. After 18 months, the CFO asks for the EBIT impact. None of the pilots can be attributed to a measurable P&L line. The reason: each pilot was treated as an experiment, not an operating model change.
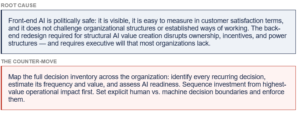
AP2: “AI as a Channel Feature, Not an Operating Model Redesign”
HOW IT MANIFESTS ORGANIZATIONALLY
AI investment concentrated in customer-facing chatbots, recommendation widgets, and marketing personalization. Network operations, supply chain, financial decisioning, and merchandising are unchanged.
THE EVIDENCE
The research consensus across McKinsey, Accenture, WEF, and IDC is unambiguous: the structural cost and revenue value of AI is in network assurance, demand intelligence, inventory optimization, financial decisioning, and workforce productivity — not the front-end. McKinsey: the organizations achieving the highest AI ROI are those that redesigned back-end processes, not those that deployed consumer-facing features.
A SPECIFIC EXAMPLE
A retailer deploys an AI chatbot for customer service (visible, measurable) while the merchandising team continues to make assortment decisions the same way they did in 2015. The chatbot saves $5M annually. The AI-redesigned merchandising process would have saved $50M — but was never initiated because it was harder to demonstrate and more disruptive to implement.
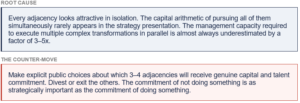
AP3: “Chase Every Adjacency Simultaneously”
HOW IT MANIFESTS ORGANIZATIONALLY
A strategic plan that commits the retailer to being a D2C leader, a platform orchestrator, a media company, a healthcare provider, a global retailer, and an AI infrastructure provider — with insufficient capital, talent, or management focus to execute any of them credibly.
THE EVIDENCE
WEF’s 2026 paper frames the choice explicitly. Accenture: operators that try to modernize networks, build digital cores, and capture every adjacency simultaneously overwhelm their change capacity. PwC advocates for “puretone” portfolio models — fewer, cleaner, higher-conviction bets. NRF 2026: “‘Doing it all’ is so 2019; the focus for 2026 is on knowing who you serve, what matters most to them, and how to deliver.”
A SPECIFIC EXAMPLE
A mid-market grocery retailer launches initiatives in retail media, private label expansion, direct-to-consumer e-commerce, healthcare clinics, and international expansion — simultaneously. After three years, none are at scale. The retail media network has $2M in revenue (needs $50M+ to be credible). The international expansion has one pilot store. The management team has been absorbed by crisis management across all fronts.
AP4: “Modernize the Front End, Preserve the Legacy Core”
HOW IT MANIFESTS ORGANIZATIONALLY
Investment in digital customer experience, AI-powered care, and modern API gateways — all layered on top of fragmented legacy OMS, batch-processing inventory systems, and monolithic ERP.
THE EVIDENCE
Every AI initiative, every personalization program, and every retail media business is blocked by the same legacy OMS/inventory constraint. McKinsey: “A broad and integrated data foundation is essential to redesign processes end-to-end.” Gartner: composable BSS reduces deployment timelines by 50% — but only for operators that have done the core simplification work first. The AI cannot make decisions on data it cannot see, in real time, across the full picture.
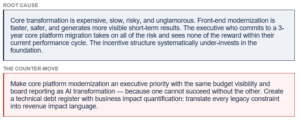
A SPECIFIC EXAMPLE
A fashion retailer invests $30M in a new digital storefront with AI personalization. The AI recommendation engine is state-of-the-art. But the inventory data feeding it is updated every 6 hours via batch process. The AI recommends products that are out of stock. The conversion rate from AI recommendations is actually lower than the rule-based system it replaced — because the inventory data is inaccurate.
AP5: “Partner Hyperscalers Without Defending Control Points”
HOW IT MANIFESTS ORGANIZATIONALLY
Deep strategic partnership with one or two hyperscalers that provides cloud scale, AI tooling, and distribution capability — with no explicit protection of the retailer’s differentiating assets.
THE EVIDENCE
Deutsche Telekom explicitly identified this risk and responded with a dual strategy: Google partnership for specific capabilities plus its own sovereign cloud infrastructure. Vodafone’s deep Microsoft dependence is the contrasting model. In retail: a retailer that integrates its product catalog, pricing, customer data, and transaction flow into a hyperscaler’s AI commerce infrastructure without protecting the customer relationship is in a structurally weakening position — one that will be apparent in 3–5 years when the hyperscaler introduces competing products.
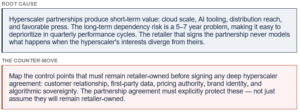
A SPECIFIC EXAMPLE
A specialty retailer fully integrates its product catalog and customer data into a major AI commerce platform for distribution and discovery. Three years later, the platform introduces its own private label in the retailer’s core category, using the product and customer data the retailer provided. The retailer’s products are systematically deprioritized in recommendations in favor of the platform’s own products.
AP6: “Build the Experience, Ignore the Data Foundation”
HOW IT MANIFESTS ORGANIZATIONALLY
Major investment in AI-powered customer experience (personalization, chatbots, virtual try-on, loyalty redesign) without the Customer Data Platform infrastructure to make it work — resulting in AI that is personalized at segment level, not individual level.
THE EVIDENCE
McKinsey: 71% of consumers expect personalized interactions; 76% frustrated when this does not happen. But true 1:1 personalization requires a unified customer identity that merges purchase history, behavioral signals, contextual data, and real-time events. Without a CDP, “personalization” is actually sophisticated segmentation — and consumers can feel the difference between being treated as a segment and being understood as an individual.
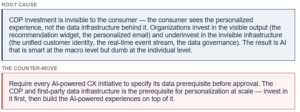
A SPECIFIC EXAMPLE
A retailer deploys an AI recommendation engine with great fanfare. The AI is state-of-the-art — but the customer data it uses is assembled from 7 different source systems with different customer ID formats, different update frequencies, and no unified governance. The recommendation engine recommends products the customer bought last month, recommends products in the wrong size, and addresses customers by names from data records that have not been updated in years.
AP7: “Treat Sustainability as ESG Reporting, Not Business Strategy”
HOW IT MANIFESTS ORGANIZATIONALLY
Sustainability program that produces an annual report, achieves third-party certification, and communicates commitments — without generating incremental revenue, reducing structural costs, or building competitive differentiation.
THE EVIDENCE
Consumers willing to pay 9.7% more for sustainable products (Zappi 2026). Resale growing 11x faster than traditional retail. EU Ecodesign Regulation mandating Digital Product Passports with regulatory non-compliance carrying market access risk. GenZ: 6 in 10 cite climate concern as a major purchase factor. The evidence that sustainability is commercially valuable is now overwhelming — but most sustainability programs are designed for reporting, not for commercial impact.
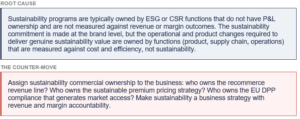
A SPECIFIC EXAMPLE
A major retailer publishes annual sustainability reports with impressive targets and third-party certification. Meanwhile, a competitor launches an owned recommerce platform, captures the resale margin in their core category, acquires GenZ customers at 40% lower CAC through resale, and achieves DPP compliance 18 months ahead of the regulatory deadline. The first retailer’s sustainability program produced excellent PR. The second retailer’s produced a new revenue stream.
10 Strategic Priorities for Retail Leaders: Sequencing the Response
These are not strategic recommendations — they are the decisions that the research evidence identifies as decisive for retail leadership in 2026–2027. Each is sequenced by urgency. Each includes the risk of inaction and the capital implication, because every priority is also a resource allocation choice.

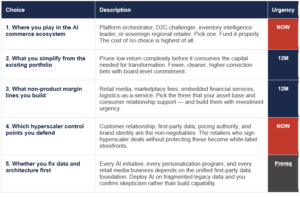
THE DECISION
Platform orchestrator, D2C challenger, inventory intelligence leader, or sovereign regional retailer. These are not compatible strategies — each requires different capital allocation, different technology investment, different partnership strategy, and different talent. The cost of no choice is higher than the cost of a wrong choice. Every other priority in this list flows from this one. Application of the working-backwards method: before selecting the position, write the press release announcing the customer benefit that position will deliver in 2028. If that press release cannot be written clearly and compellingly, the position has not been defined — a label has been selected.
RISK OF INACTION
Without a clear position, every investment decision becomes a committee negotiation, every partnership becomes a potential threat, and every adjacency becomes a distraction. The retailers winning in 2026 made this decision in 2024.
CAPITAL IMPLICATION
This decision determines where the next 3–5 years of capital allocation goes — it is not a strategy document, it is a resource commitment.
WHAT SUCCESS LOOKS LIKE
A single clear sentence that every employee, partner, and investor can articulate: “We are the [X] for [Y customer] by winning on [Z capability].”

THE DECISION
Google launched UCP on January 11, 2026 with Shopify, Walmart, Target, Wayfair, Etsy, and 20+ partners. The protocol is already live in Google Search AI Mode and Gemini. Microsoft Copilot embedded checkout launched simultaneously. The protocol is becoming the infrastructure standard for AI-mediated commerce. Retailers that integrate early set the terms. Retailers that integrate late integrate on terms set by others.
RISK OF INACTION
Every week of non-integration is a week of invisibility to the AI agents that are beginning to influence purchase decisions. Once the standard hardens and consumer AI behavior forms around it, late integrators face significantly higher integration costs and smaller share of the AI-mediated commerce flow.
CAPITAL IMPLICATION
Integration investment: primarily engineering and data quality — the product catalog, inventory feeds, and pricing APIs required for UCP are investments with compounding returns across all AI commerce channels.
WHAT SUCCESS LOOKS LIKE
Your products appear in Google AI Mode recommendations, Gemini purchase flows, and Microsoft Copilot shopping experiences with accurate real-time pricing and inventory.

THE DECISION
McKinsey (January 2026, n=125): AI drives less than 2% of total revenues for more than half of operators that have tested AI use cases — despite years of piloting. The gap is operating model redesign, not technology capability. Tie every AI program to hard P&L metrics: conversion rate, basket size, markdown rate, return rate, MTTR, churn, deal velocity. The pilot that cannot be attributed to a P&L line should be closed.
RISK OF INACTION
AI programs that do not produce measurable commercial impact within 12–18 months lose organizational credibility — and then the real AI investment, the operating model redesign, becomes impossible to fund because “AI didn’t deliver.”
CAPITAL IMPLICATION
AI capital should be allocated against commercial outcomes, not technology capabilities. The merchandising AI that reduces markdown by 2% on a $500M assortment is worth more than the chatbot that achieves 85% resolution rate on tier-1 queries.
WHAT SUCCESS LOOKS LIKE
AI programs have explicit P&L owners, commercial targets, and quarterly review with CFO and COO. Programs that miss targets for two consecutive quarters are restructured or closed.

THE DECISION
Every AI initiative, every retail media business, and every personalization program is blocked by the same legacy constraint: fragmented customer data, batch-processing inventory systems, and no real-time behavioral event stream. The retailers who invest in the Customer Data Platform, unified OMS, and real-time data infrastructure in 2026 will have structural advantages in every AI initiative they run through 2030. The retailers who skip this step will run AI on fragmented data and get results that confirm their skepticism.
RISK OF INACTION
Retailers that deploy AI without the data foundation will confirm executive skepticism about AI (“the chatbot recommended products we didn’t have”) and face an even harder organizational battle to fund the real transformation.
CAPITAL IMPLICATION
CDP and data infrastructure investment: typically $20–50M for a retailer with $1–5B revenue, with ROI delivered through personalization improvement, retail media revenue, and AI initiative effectiveness. The foundation investment generates 10x its cost in AI-enabled commercial improvements.
WHAT SUCCESS LOOKS LIKE
A unified customer identity exists across all channels, real-time inventory data is available at the SKU level, and every AI initiative can be instrumented against a commercial KPI.

THE DECISION
Gartner: 91% of service leaders under pressure to implement AI. McKinsey: 71% of consumers expect personalized interactions; 76% frustrated when it does not happen. Accenture: LLMs are becoming the new influencers. The customer experience is no longer designed — it is computed, in real time, for every individual, across every touchpoint. The retailers building 1:1 AI-native CX capability in 2026 are establishing a loyalty advantage that will be nearly impossible to close by 2028.
RISK OF INACTION
The CX gap compounds: retailers with AI-native CX continuously learn from every consumer interaction, improving recommendations and reducing friction. Retailers without it remain at a static capability level while the bar rises. The gap between leaders and laggards is doubling every 18 months.
CAPITAL IMPLICATION
CX AI investment must include the CDP foundation (Priority 4), the AI models for personalization and service, and the associate empowerment tools — the three components together determine whether AI-native CX is genuine or cosmetic.
WHAT SUCCESS LOOKS LIKE
Personalized recommendation relevance is measured and improving quarterly. First-contact resolution rate for AI-handled service interactions meets or exceeds human agent rates. Customer effort score improves year-over-year.

THE DECISION
Retail media, marketplace fees, embedded financial services, logistics-as-a-service — these are not nice-to-have revenue diversification options. They are the business model of the winning retailers. Walmart’s retail media growth is its fastest-growing segment. Amazon earns more from advertising and marketplace fees than from first-party retail. Costco earns more from membership fees than from product margin on the same inventory. Pick the 3–4 non-product margin lines that your asset base and consumer relationship support — and build them with the same investment urgency as any product category.
RISK OF INACTION
The retailer that does not build non-product margin lines by 2027 will face permanent structural margin disadvantage vs. platform-model competitors — who can price products at or below cost because their margin comes from the ecosystem, not the transaction.
CAPITAL IMPLICATION
Retail media requires first-party data infrastructure + advertising technology: $15–40M for a retailer with $1–5B revenue, with a path to $30–100M annual high-margin revenue at scale. Marketplace requires seller acquisition + technology: $10–25M investment, with revenue that scales with seller count and GMV.
WHAT SUCCESS LOOKS LIKE
At least three non-product revenue lines are live, each with a defined path to $10M+ annual revenue, and at least one is generating positive EBITDA contribution.

THE DECISION
95% of retail executives expect tariffs to push costs higher (Deloitte 2026). De minimis is permanently gone for Chinese imports; the global exemption ends in 2027. HSBC: 83% of global businesses pursuing nearshoring. The retailers that correctly bet on the new trade architecture in 2026 will have structural supply chain cost advantages through 2035. The retailers that wait for “clarity” will be implementing strategies designed for a world that no longer exists.
RISK OF INACTION
Supply chain decisions have 18–36 month lead times. A retailer that begins nearshoring evaluation in 2027 will not have operational nearshored supply chains until 2029 — by which time competitors who started in 2024–2025 will have 3–4 years of optimization advantage.
CAPITAL IMPLICATION
Nearshoring investment: $20–100M depending on category complexity and volume, with payback through tariff savings, lead time reduction, and supply chain resilience — typically 2–4 year payback on major categories.
WHAT SUCCESS LOOKS LIKE
Supply chain tariff exposure is mapped by SKU and country of origin. A nearshoring roadmap exists for the top 5 tariff-exposed categories. At least one nearshored supply chain is operational.

THE DECISION
The retailers without an explicit written hyperscaler strategy will find the strategy written for them — by the hyperscalers. UCP adoption, Google/Walmart/Microsoft partnership dynamics, AWS retail infrastructure, and Shopify platform relationships are all hyperscaler strategy decisions being made by default in most organizations. The explicit strategy must answer three questions: where do we partner for scale we cannot achieve alone? Where do we compete to protect category leadership? Where do we defend the control points that define our differentiation?
RISK OF INACTION
The control points that define retail differentiation — customer relationship, first-party data, pricing authority, brand identity — are under systematic capture by hyperscaler platform strategies. Once transferred, they are structurally difficult to reclaim.
CAPITAL IMPLICATION
This is not primarily a capital decision — it is a governance and negotiation decision. The capital implications flow from the partnership choices made, not from the strategy itself.
WHAT SUCCESS LOOKS LIKE
A written hyperscaler strategy exists, reviewed by the board, with explicit protection clauses for customer relationship, first-party data, and pricing authority in all major platform partnerships.

THE DECISION
Consumers willing to pay 9.7% more for sustainable products. Resale growing 11x faster than traditional retail. EU DPP mandates market access for any global retailer with EU presence. GenZ loyalty is values-based — and sustainability authenticity is a GenZ loyalty driver. The retailers that treat sustainability as a reporting function miss $100M+ annual revenue opportunities that their competitors are capturing.
RISK OF INACTION
The GenZ loyalty window is the window during which this generation forms their primary retail relationships. Retailers that are perceived as inauthentic on sustainability will not recover those relationships — the cost of inauthenticity is not brand damage today, it is GenZ wallet share permanently captured by competitors.
CAPITAL IMPLICATION
Recommerce program: $5–15M to build or partner, with path to $30–80M revenue at scale in most major retail categories. DPP compliance: $10–30M data infrastructure investment that simultaneously enables recommerce, sustainability marketing, and EU market access.
WHAT SUCCESS LOOKS LIKE
A recommerce revenue line exists and is growing. Sustainability product premiums are measurable and tracked. EU DPP compliance is on track for the regulatory deadline.

THE DECISION
The retailers who built the AI infrastructure, the data platform, the retail media network, the marketplace, and the fulfilllment network in 2024–2026 will have structural advantages that subscale operators cannot close with incremental investment. This requires capital reallocation at a pace that makes the board uncomfortable — because the comfortable pace produces the median outcome, and the median outcome in retail in 2026 is not a viable destination.
RISK OF INACTION
Incremental capital reallocation produces incremental competitive improvement. The gap between platform-model retailers and product-margin-only retailers is compounding. The time to close that gap with aggressive investment is narrowing. A retailer that reallocates gradually will always be catching up — never ahead.
CAPITAL IMPLICATION
Target: 15–20% of capex redirected from maintenance and incremental improvement toward the strategic capabilities in Priorities 1–9. The specific investment is less important than the decision discipline — what to stop funding is as important as what to start funding.
WHAT SUCCESS LOOKS LIKE
The capex allocation for the next 3 years has been reviewed against the strategic priorities in this analysis. At least 15% has been explicitly redirected from low-return maintenance toward strategic capability investment. The board has approved the reallocation.
Conclusion: The Five Strategic Choices That Determine Competitive Position Through 2030


Appendix: Top 20 Global Retailers — Strategic Signal Analysis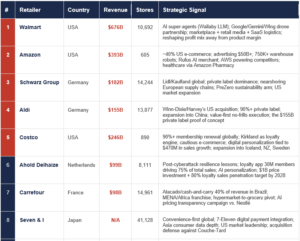
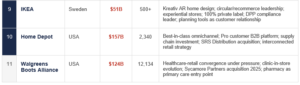
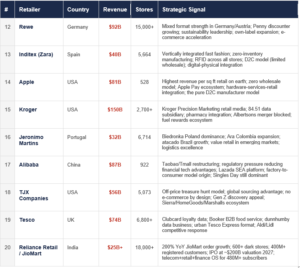
Source: NRF/Kantar Top 50 Global Retailers 2025 (based on 2024 revenues). Rankings require direct investment in at least three countries. Revenue figures are total company revenues in 2024. Strategic signal analysis is synthesized from SEC filings, annual reports, operator announcements, and NRF coverage.
Key observation: The Top 20 demonstrates the convergence thesis — Apple (consumer electronics manufacturer operating retail), Inditex (vertically integrated manufacturer with zero wholesale), Amazon (technology and logistics company operating as retailer), and JioMart/Reliance (telecom-turned-retail-ecosystem) all appear alongside traditional grocery and mass-market retailers. The boundary of “retail” as a category has already dissolved at the highest levels of the industry.
Leave a Reply