Logistics Trends Analysis- The Shipment Graph and Seven Meta-Forces Reshaping Global Logistics in 2026
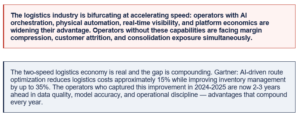
Logistics has reached an inflection point. The forces shaping the industry in 2026 are not cyclical adjustments to freight rates and carrier capacity. They are structural transformations in what logistics is, who earns from it, and what the source of durable advantage will be through 2030. This analysis synthesizes signals from Gartner, McKinsey, Deloitte, FTI Consulting, the European Logistics Association, and direct operator intelligence across the global Top 20 logistics operators — to argue a central thesis that most industry analysis misses.
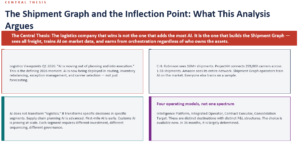
C.H. Robinson processes 18 million+ shipments annually. Amazon Logistics sees every order, every carrier choice, every delivery exception across its network — and trains its AI on that data continuously. Uber Freight, Flexport, and digital freight platforms are accumulating the shipment data that makes their AI better with every transaction. The incumbents who see only their own freight — no matter how much AI they deploy on that subset — are building AI on a sample. The Shipment Graph operators are building AI on the market.
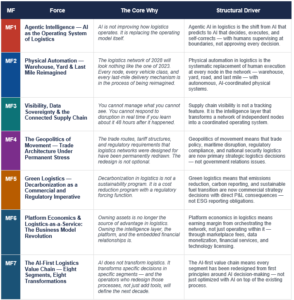
The 7 Meta-Forces at a Glance
The Four Operating Models: Where Every Logistics Operator Will Land
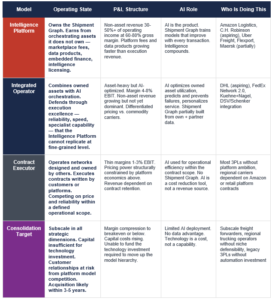
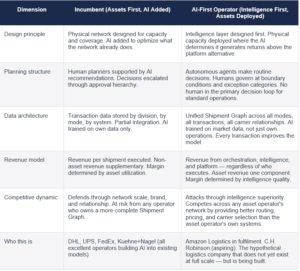
Every logistics operator in 2026 is — whether they have named it or not — making a choice between four distinct operating models. These are not aspirational categories. They are observable operating states with distinct P&L structures, distinct technology requirements, and distinct competitive dynamics. The choice is available now. In 36 months, it will be largely determined by decisions made in 2025-2026.
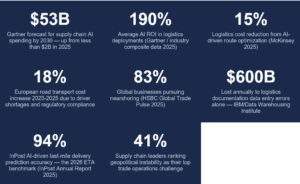
Key Statistics from the Research Corpus
Master Trend Map: All 32 Trends Across 7 Meta-Forces
The 32 trends span 7 meta-forces. Meta-Forces 1-6 cover cross-cutting structural forces. Meta-Force 7 disaggregates the AI transformation to each of the 8 segments of the logistics value chain — from Supply Chain Planning through Last-Mile Delivery.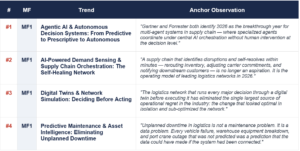

The 7 Meta-Forces: Why These Forces, Why Now, Why Structural

Logistics has experienced many technology cycles. EDI in the 1980s. TMS in the 1990s. GPS tracking and e-commerce disruption in the 2000s. Platform freight in the 2010s. Each wave improved how logistics operated. The 2026 inflection is different in kind, not just degree: three forces are reshaping what logistics is (AI replacing the operating model, physical automation replacing the workforce), two are reshaping where it operates (geopolitics permanently redrawing trade architecture, green regulation creating new market access requirements), one is reshaping how it earns (platform economics replacing asset utilization as the source of margin), and one disaggregates the AI transformation to every specific segment of the value chain (the AI-first value chain, from supply chain planning through last-mile delivery). All seven are operating simultaneously and reinforcing each other.
The Causal Logic: How the 7 Forces Interact
The Logistics Value Chain: Eight Segments, Eight AI Transformations
The AI transformation of logistics is not a single event. It is eight simultaneous transformations happening at different speeds, with different technology maturity levels, in eight distinct segments of the value chain. Understanding which segment is most advanced, which offers the fastest near-term ROI, and which requires foundational investment before AI can be deployed — is the prerequisite for any logistics AI investment agenda.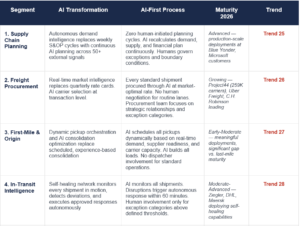

The Shipment Graph: The Asset That Incumbents Are Not Building
The Shipment Graph is the accumulated intelligence of every freight transaction — every origin, destination, carrier, lane, rate, exception, delivery outcome, and customer behavior pattern — combined into a continuously learning model of the entire freight market. The operator who owns the most complete Shipment Graph does not just have better AI. They have structurally better decisions on every new shipment because their model is trained on the market, not just on their own operations.
The Shipment Graph creates three compounding advantages that asset ownership cannot replicate: (1) Pricing intelligence — the operator who sees all freight knows the true market rate, not just the rate they can defend; (2) Carrier intelligence — the operator who sees all carriers across all lanes for all shippers knows carrier reliability and capacity at a resolution no individual shipper achieves; (3) Demand intelligence — the operator who sees all shipments can predict demand shifts, capacity constraints, and disruption impacts before they affect individual operators who see only their own data.
The AI-First Logistics Company: What Incumbents Are Not Competing With — Yet
An AI-first logistics company is not a traditional operator that has added AI. It is a company designed from first principles around AI decision-making, with physical assets deployed to serve the AI’s conclusions rather than the reverse. The architectural difference is fundamental and the competitive implications are severe for incumbents.
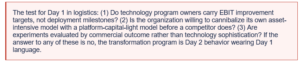
Day 1 Logistics Organizations vs. Day 2 Logistics Organizations
Every anti-pattern in logistics transformation has the same root cause: an organization managing the existing business rather than building the next one. The Day 1 logistics operator is customer-obsessed, experiments rapidly, and is willing to invest in capabilities before the commercial case is proven by competitors. The Day 2 logistics operator optimizes the existing network, invests defensively, and requires a competitor’s success as proof before committing. In 2026, the Day 1 vs. Day 2 distinction is visible in the balance sheet, the customer retention rate, and the EBIT margin — not just in the strategic narrative.
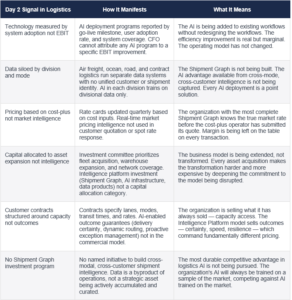
The Incumbent Vulnerability Diagnostic: Logistics-Specific Day 2 Signals
The following are observable organizational signals that distinguish Day 2 logistics operators from Day 1 operators. These are not capability failures — they are structural characteristics of organizations managing a mature asset business rather than building the next one. Every major logistics operator exhibits some of these signals. The diagnostic value is in the pattern.
Meta-Force 1: Agentic Intelligence — AI as the Operating System of Logistics
Trend Summary
Trend Deep-Dives
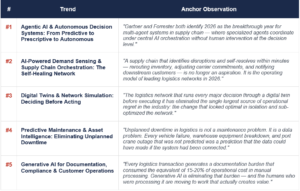
Trend #1 — Agentic AI & Autonomous Decision Systems: From Predictive to Prescriptive to Autonomous

WHY THIS EXISTS
Gartner expects spending on supply chain management software with agentic AI to grow from less than $2 billion in 2025 to $53 billion by 2030. Uber Freight CTO Val Marchevsky: “The biggest opportunities will come from using AI to redesign processes for efficiency — not from layering AI onto broken processes.” Traditional predictive AI forecasts outcomes. Agentic AI decides and acts autonomously. The Human-on-the-Loop (HOTL) model — where AI handles routine and urgent decisions, and humans supervise exception cases — is replacing the Human-in-the-Loop model across leading logistics operators. DAT Freight: agentic AI is already monitoring capacity, flagging coverage risks, and managing exceptions without waiting for a human to initiate.
BUSINESS IMPACT
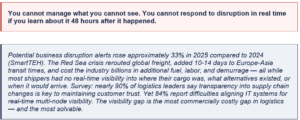
• Organizations using agentic AI report reclaiming 40+ hours monthly on routine tasks; tasks that took days now finish in minutes (McKinsey benchmarks)
• The multi-agent model is the breakthrough: one agent qualifies carrier capacity, another prices the lane, a third validates compliance requirements — they maintain shared context and hand off without human intervention
• Gartner warning: more than 40% of agent projects will fail by 2027 due to unclear business value, runaway costs, and agents that violate policy — governance frameworks are as critical as the technology itself
STRATEGIC IMPLICATIONS
• Define the human-AI boundary explicitly before deploying autonomous agents: which decisions can AI make autonomously, which require human approval, and which require executive sign-off — the boundary definition is the governance framework
• Sequence agent deployment from the highest-frequency, most rule-based decisions outward — carrier selection, load tendering, route optimization, and exception flagging are the established entry points
• Build kill switches, audit trails, and real-time monitoring as design requirements, not post-deployment additions — agents operating with autonomy require the same governance infrastructure as any regulated process
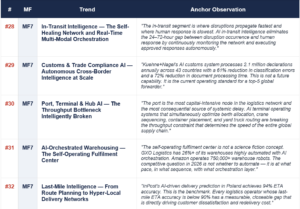
Trend #2 — AI-Powered Demand Sensing & Supply Chain Orchestration: The Self-Healing Network

WHY THIS EXISTS
McKinsey: AI-driven demand sensing improves forecast accuracy by up to 35% vs. statistical methods alone, with corresponding improvements in inventory carrying cost and stockout rates. The concept of the “self-healing supply chain” — where disruptions are identified and resolved in real time with minimal human intervention — is being deployed by leading operators using a combination of digital twins, AI demand sensing, and multi-agent coordination systems. Deloitte: AI agents “autonomously optimize inventory, logistics, and procurement in real time.” Platform Science SVP Darrin Demchuk: “Intelligent agents will manage workflows in real time across vehicles, back-office systems.”
BUSINESS IMPACT
• Demand sensing combining POS data, weather signals, social listening, and macroeconomic indicators in real time is reducing forecast error by 30-50% vs. traditional weekly-cadence planning
• The self-healing network eliminates the 24-72 hour human response lag to supply disruptions — AI reroutes, reorders, and reallocates in minutes, directly improving service levels and reducing emergency freight spend
• Orchestration AI connecting TMS, WMS, OMS, and supplier systems in a single real-time data layer is the prerequisite for every other AI capability in this analysis — without it, each system optimizes locally and sub-optimizes globally
STRATEGIC IMPLICATIONS
• Build the unified data layer first: real-time data connections between TMS, WMS, ERP, carrier systems, and demand signals is the prerequisite for every AI capability — without it, AI optimizes individual steps while the network sub-optimizes
• Establish supply chain orchestration as a C-level priority with dedicated budget — the technology exists; the organizational change required to use it (redesigning roles, incentives, and processes around AI recommendations) does not happen organically
• Measure AI performance in P&L terms: forecast accuracy improvement in dollars of inventory cost, rerouting speed in dollars of emergency freight avoided, self-healing rate as a percentage of disruptions resolved without human intervention
Trend #3 — Digital Twins & Network Simulation: Deciding Before Acting

WHY THIS EXISTS
Digital twins create real-time virtual models of logistics networks — warehouses, fleets, routes, carrier capacity, customs status — that simulate disruptions and test responses before committing to physical execution. McKinsey and IDC both identify digital twins as the key technology enabling the transition from reactive to proactive logistics management. Every fuel optimization, route change, or network redesign decision can be tested against the twin before it affects the physical network. The combination of digital agents (which decide) and digital twins (which simulate consequences) is the highest-impact AI combination for complex logistics networks, per Deloitte.
BUSINESS IMPACT
• Network redesign decisions that previously required 3-6 months of analysis can be simulated and validated against a digital twin in hours — fundamentally changing the pace at which logistics operators can respond to market shifts
• Warehouse layout optimization using digital twins reduces re-slotting costs and improves pick efficiency — decisions that previously required shutting down operations for physical testing can be validated virtually first
• Carbon footprint simulation: digital twins allow carriers to model the emissions impact of route changes, modal shifts, and network redesign decisions before committing — directly enabling CBAM compliance strategy (see MF5)
STRATEGIC IMPLICATIONS
• Start with a digital twin for your highest-complexity, highest-cost network element — the warehouse, the primary distribution hub, or the most volatile freight lane — before attempting network-wide simulation
• Integrate real-time data feeds into the twin from day one: a static digital twin is a planning tool; a dynamic twin connected to live operational data is an intelligence system
• Use the twin as the decision validation layer for all major network changes: any reconfiguration that has not been tested against the twin before execution is a preventable risk
Trend #4 — Predictive Maintenance & Asset Intelligence: Eliminating Unplanned Downtime

WHY THIS EXISTS
AI-powered predictive maintenance analyzes sensor data, engine telemetry, usage patterns, and environmental conditions to predict component failures before they occur. For fleet operators, this means scheduling maintenance during planned downtime rather than reacting to breakdowns that strand loads. For warehouse operators, it means predicting conveyor, sorter, and robot failures before they halt fulfillment. For port operators, it means predicting crane and terminal equipment failures before they create berth delays. Deloitte: adoption of physical AI in manufacturing and logistics is especially advanced, with autonomous systems already reshaping operations.
BUSINESS IMPACT
• Predictive maintenance reduces unplanned downtime by 25-45% in documented fleet deployments, directly improving asset utilization and on-time delivery performance
• Fleet operators using AI predictive maintenance reduce total maintenance cost by 10-15% through parts optimization, labor scheduling, and failure prevention vs. reactive repair cost
• Port terminal operators using predictive maintenance on cranes and automated stacking systems are reducing berth wait time — the most expensive cost in port logistics — directly improving vessel utilization and port capacity
STRATEGIC IMPLICATIONS
• Instrument every major asset with IoT sensors before deploying predictive maintenance AI — the AI requires the sensor data; deploying AI without sensor infrastructure produces no value
• Integrate predictive maintenance with maintenance scheduling and parts inventory systems: predicting failure is valuable only if the maintenance can actually be scheduled before it happens
• Build predictive maintenance ROI cases in operational language: avoided breakdown cost, on-time delivery improvement, and asset utilization improvement — not technology cost
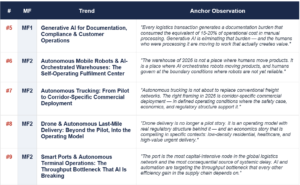
Trend #5 — Generative AI for Documentation, Compliance & Customer Operations

WHY THIS EXISTS
Logistics generates a staggering volume of documentation: bills of lading, customs declarations, certificates of origin, dangerous goods documentation, proof of delivery, carrier contracts, rate confirmations, and compliance filings. Generative AI is automating the creation, processing, extraction, and validation of this documentation at a scale and accuracy that human processing cannot match. C.H. Robinson is deploying generative AI across carrier procurement, document processing, and market intelligence. Flexport has built AI-powered customs automation as a core capability. WTO: AI could boost the value of trade in goods and services by nearly 40% by 2040, partly through reducing documentation and compliance costs.
BUSINESS IMPACT
• AI-powered document processing reduces customs clearance times by 30-50% in documented deployments, directly reducing demurrage costs and improving delivery reliability
• Generative AI for carrier contracting (AI-drafted rate confirmations, contract terms review, exception clause identification) reduces legal and procurement costs while improving contract quality and compliance
• Customer-facing generative AI (shipment status queries, claims processing, rate quotation) handles the majority of routine customer interactions without human agents — freeing logistics customer service staff for complex, relationship-critical interactions
STRATEGIC IMPLICATIONS
• Audit the documentation volume across your operation by process step: where is the most manual time spent on document creation, extraction, or validation? These are the first generative AI targets
• Integrate AI document processing with your TMS and customs systems: extracted data should flow directly into the operational systems, not create a new manual data entry step
• Build compliance into the AI from the start: AI-generated documents must meet the regulatory standards of every jurisdiction they are processed in — the AI needs the compliance rules, not just the document templates
Meta-Force 2: Physical Automation — Warehouse, Yard & Last Mile Reimagined
Trend Summary
Trend Deep-Dives
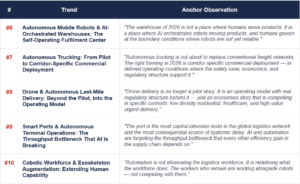
Trend #6 — Autonomous Mobile Robots & AI-Orchestrated Warehouses: The Self-Operating Fulfillment Center

WHY THIS EXISTS
Autonomous Mobile Robots (AMRs) have crossed from early majority to mainstream deployment. They operate without supervision, integrate into existing layouts without structural modification, and are fleet-scalable during demand peaks. GXO Logistics: 26%+ of warehouses are highly automated, with AI orchestration coordinating AMR fleets, autonomous forklifts, and goods-to-person systems. Amazon: 750,000+ robots across its global fulfillment network. The AI orchestration layer — coordinating multiple robot types, optimizing routes, managing congestion, and integrating with WMS — is the strategic differentiator. Systems like KNAPP KiSoft FCS coordinate fleets in real time, distributing orders, optimizing travel paths, and adjusting priorities without human dispatcher intervention.
BUSINESS IMPACT
• AMR deployment reduces pick labor cost by 50-70% in documented deployments while simultaneously improving pick accuracy from human-level 99.5% to 99.99% — the margin impact is structural, not incremental
• Goods-to-person systems (where robots bring products to stationary human pickers) double or triple throughput per pick station vs. traditional walk-pick designs while reducing picker fatigue and error rates
• Scalability is the AMR economic advantage: fleet size can be adjusted in hours during demand peaks without hiring — a structural response to the predictable demand volatility that is now the industry baseline
STRATEGIC IMPLICATIONS
• Define the human-robot boundary in your warehouse operations before selecting automation: which tasks benefit from robotics (repetitive, high-volume, predictable), which benefit from human dexterity (irregular products, exception handling, customer-facing), and which benefit from human judgment (returns processing, exception goods)
• Invest in the AI orchestration layer before the physical robots: the orchestration software that coordinates robot fleets is where the operational intelligence lives — the robot hardware is increasingly commoditizing
• Design for modular scaling from day one: AMR deployments that are designed to scale with demand are 40-60% more cost-effective than those designed for peak capacity
Trend #7 — Autonomous Trucking: From Pilot to Corridor-Specific Commercial Deployment

WHY THIS EXISTS
The market has moved from broad promise to corridor-specific execution. Aurora Innovation began commercial autonomous trucking operations on specific Texas-to-Oklahoma corridors in 2024. Waymo Via is expanding freight operations. Kodiak Robotics is operational in defined lanes. The economic case is specific and real: in constrained operating environments with repeatable routes, autonomous trucks achieve lower cost-per-mile than human-driven equivalents — primarily by eliminating the Hours of Service constraint that prevents 24/7 operation. The industry is not moving toward one monolithic model of autonomous freight. It is moving toward selective autonomy in domains where operating conditions support it.
BUSINESS IMPACT
• Hours of Service elimination: autonomous trucks operate 22+ hours per day vs. 11 for human-driven — doubling asset utilization on long-haul corridors where the economics are strongest
• Cost-per-mile on defined autonomous corridors is 15-25% below human-driven equivalents in current commercial deployments — with further improvement as fleet scale increases and safety driver costs are eliminated as regulatory frameworks mature
• Long-haul hub-to-hub automation combined with human-driven urban last mile creates a hybrid model that captures autonomous efficiency without requiring autonomous operation in complex urban environments
STRATEGIC IMPLICATIONS
• Map your freight network for autonomous corridor suitability: high-volume, highway-dominant, predictable routes between defined hubs are the first targets — identify which of your lanes meet these criteria
• Begin carrier relationship development with autonomous trucking operators now — the capacity will be limited in 2026, and shippers with established relationships and defined lane commitments will have preferential access as fleets scale
• Do not wait for nationwide autonomous trucking — evaluate corridor-specific pilots on your highest-volume lanes where the operating environment supports current-generation autonomous systems
Trend #8 — Drone & Autonomous Last-Mile Delivery: Beyond the Pilot, Into the Operating Model

WHY THIS EXISTS
Wing (Alphabet) operates commercial drone delivery in multiple markets. Starship Technologies has completed over 6 million autonomous ground deliveries globally. Amazon MK30 drone program is expanding commercial deployment. EU U-space urban drone regulation framework takes full effect in 2027, enabling scaled urban drone logistics. Current cost per delivery by autonomous vehicle: EUR 1.20-2.50 versus EUR 4-8 for human last-mile delivery — the economics are compelling where route density and regulatory permission align. JD Logistics and SF Express operate drone delivery at commercial scale in China, providing the clearest evidence of what scaled autonomous last mile looks like.
BUSINESS IMPACT
• Drone delivery economics are superior to human last-mile in defined contexts: rural/suburban low-density routes where human driver productivity is lowest, healthcare urgent delivery (pharmaceuticals, blood products, medical devices), and high-value parcel delivery where signature-required security is a constraint
• Ground autonomous delivery robots (Starship, Nuro, Kiwibot) are demonstrating sustainable unit economics in university campuses, business districts, and controlled residential environments — the operating context constraint is real but the economics within that context are proven
• The last-mile opportunity is structural: last-mile delivery represents 30-53% of total supply chain cost (Gartner/Capgemini) and is the most labor-intensive, least efficient segment of the logistics network — autonomous delivery is the only structural response to this cost structure
STRATEGIC IMPLICATIONS
• Evaluate your last-mile network for autonomous delivery suitability: route density, parcel profile (weight, dimensions, value), regulatory permission in target geographies, and customer acceptance are the four assessment dimensions
• Partner with autonomous delivery operators for specific route clusters rather than attempting end-to-end autonomous deployment — the hybrid model (autonomous where conditions support it, human where they do not) captures 60-70% of the cost reduction potential with significantly less operational complexity
• Design the customer experience for autonomous delivery from day one: the notification, the delivery confirmation, the exception handling (missed deliveries, damaged goods) requires as much design attention as the autonomous vehicle itself
Trend #9 — Smart Ports & Autonomous Terminal Operations: The Throughput Bottleneck That AI Is Breaking

WHY THIS EXISTS
Port automation is advancing from single-point improvements (automated stacking cranes, automated guided vehicles) to fully integrated terminal operating systems. Rotterdam, Singapore (PSA), Shanghai, and Los Angeles are deploying AI-managed terminal operations. AI optimizes berth allocation, vessel sequencing, container placement, and yard truck routing simultaneously — tasks that were previously managed by human dispatchers with limited real-time information. Red Sea disruption in 2025-2026 has rerouted significant vessel traffic around the Cape, increasing port dwell times at European ports and demonstrating the network vulnerability of choke-point concentration.
BUSINESS IMPACT
• Automated port terminals achieve 30-50% higher throughput per berth vs. conventional terminals, with 24/7 operation and significantly lower labor cost per container move
• AI-optimized berth planning reduces vessel waiting time — the most expensive cost in port logistics — directly improving vessel utilization rates for carriers and reducing demurrage charges for shippers
• Port AI integrating with vessel tracking, customs systems, and inland haulage generates the real-time visibility that supply chain control towers require — the port data is the last major gap in end-to-end supply chain visibility
STRATEGIC IMPLICATIONS
• Engage with port authority technology programs before selecting port partners: the technology capability of the port (real-time data API, automated systems, digital documentation) is as important as its geographic position and rate
• Build port pre-arrival documentation and customs pre-clearance into your standard operating procedure — AI-powered pre-clearance reduces dwell time by 20-40%, directly reducing demurrage cost
• Develop multi-port routing strategies that reduce dependence on any single port pair: the Red Sea disruption demonstrated that single-route dependencies create systemic vulnerability that no carrier contract can protect against
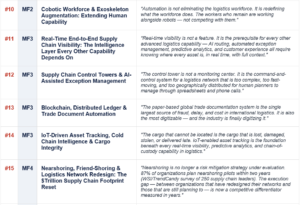
Trend #10 — Cobotic Workforce & Exoskeleton Augmentation: Extending Human Capability

WHY THIS EXISTS
Cobotic systems (collaborative robots designed to work alongside humans rather than replace them) are the fastest-growing segment of warehouse automation in 2026. Exoskeletons that reduce the physical strain of heavy lifting are deployed across major e-commerce fulfillment centers (DHL, GXO, Amazon) — reducing injury rates by 40-60% in documented deployments. The labor retention benefit is as significant as the productivity improvement: facilities with cobotic and exoskeleton programs demonstrate measurably lower turnover rates. FTI Consulting 2026 outlook explicitly identifies labor stability as a central logistics challenge — automation that retains workers is as valuable as automation that replaces them.
BUSINESS IMPACT
• Exoskeleton deployment reduces musculoskeletal injury rates by 40-60% in documented logistics deployments — directly reducing workers’ compensation costs, absenteeism, and turnover in physically demanding warehouse roles
• Cobotic systems that handle the heaviest, most repetitive tasks while humans handle the dexterity-requiring and judgment-intensive tasks achieve higher combined throughput than either humans alone or full automation — the hybrid model outperforms the pure models
• Workforce training investment for cobotic operation increases worker skill level and wage potential — creating a genuine retention tool in markets where logistics labor competition is structural and persistent
STRATEGIC IMPLICATIONS
• Evaluate exoskeleton deployment for your highest-injury-rate job roles first: heavy picking, loading/unloading, and repetitive overhead tasks are the established entry points with documented ROI
• Redesign job roles around cobot collaboration: the most effective deployments treat the cobot as a tool the human operates, not a separate system the human works around — role design matters as much as technology selection
• Measure cobotic program success in workforce terms as well as productivity terms: injury rate reduction, turnover rate, absenteeism, and worker satisfaction are the leading indicators that predict long-term operational stability
Meta-Force 3: Visibility, Data Sovereignty & the Connected Supply Chain
Trend Summary
Trend Deep-Dives
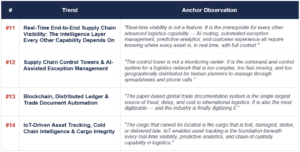
Trend #11 — Real-Time End-to-End Supply Chain Visibility: The Intelligence Layer Every Other Capability Depends On

WHY THIS EXISTS
89% of logistics leaders identify supply chain visibility as critical to customer trust and operational performance — yet most organizations still operate with batch-updated tracking data that is 4-24 hours stale. The technology to change this exists: IoT sensors on every container and pallet, GPS-connected fleet telematics, carrier API integrations feeding real-time status updates, and AI that synthesizes this data into actionable intelligence. Project44, FourKites, and Visibility Hub are enabling multi-modal real-time tracking for thousands of shippers. The business case is direct: 1% improvement in on-time delivery performance translates to measurable customer retention improvement across all shipper-carrier relationships.
BUSINESS IMPACT
• Real-time visibility enables proactive customer communication — shippers with genuine real-time tracking notify customers of delays before customers call to inquire, directly improving NPS and reducing inbound customer service volume by 30-50%
• Exception management based on real-time data reduces emergency freight spend (air upgrades, expedited trucking, spot market premium) by identifying diversions before they become crises that require expensive interventions
• End-to-end visibility across modes (ocean, air, road, rail, last mile) in a single platform eliminates the multi-system coordination that currently consumes logistics operations team capacity — freeing planners for exception resolution rather than status compilation
STRATEGIC IMPLICATIONS
• Define your visibility data requirements by stakeholder: what does the operations team need to see, what does the customer need, what does the finance team need for landed cost calculation, and what does the executive team need for risk management — these are different data products with different latency requirements
• Select visibility platforms based on carrier and mode coverage first, not feature sophistication: a technically advanced platform with 60% carrier coverage is less valuable than a simpler platform with 95% carrier coverage for your specific network
• Build API connections from visibility platforms directly into TMS and customer notification systems: visibility data that requires manual export and re-import creates the same delay it was supposed to eliminate
Trend #12 — Supply Chain Control Towers & AI-Assisted Exception Management

WHY THIS EXISTS
Supply chain control towers — centralized intelligence platforms providing real-time visibility, predictive analytics, and exception management across the full logistics network — are transitioning from aspirational architecture to operational reality. Leaders including DHL, Maersk, and Kuehne + Nagel have built or acquired control tower capabilities as core service offerings. The AI layer within control towers is the critical differentiator: AI that distinguishes between disruptions that will self-resolve (minor delay within buffer) and disruptions that require intervention (systemic delay affecting committed delivery dates) eliminates the alert fatigue that renders basic monitoring platforms operationally ineffective.
BUSINESS IMPACT
• Control towers with AI exception filtering reduce the intervention workload on logistics planners by 60-80% — rather than reviewing all exceptions, planners review only the subset that AI has determined requires human judgment
• Real-time network stress testing through control tower AI identifies cascading impact before it propagates: a single carrier capacity constraint that would previously create a delivery crisis 72 hours later is identified and rerouted within minutes
• Control towers as a service (CTaaS) are allowing mid-market shippers to access enterprise-grade network intelligence without the capital investment previously required — democratizing a capability that was previously the exclusive domain of the largest global operators
STRATEGIC IMPLICATIONS
• Define the exception escalation logic before building the control tower: what conditions trigger automated rerouting, what trigger human notification, and what trigger executive escalation — the logic is the intelligence; the technology is the execution layer
• Integrate control towers with customer notification systems: the value of knowing about a disruption before the customer is only realized if that knowledge is used to communicate proactively
• Evaluate control tower metrics in operational terms: mean time to detect disruption, mean time to resolve disruption, percentage of disruptions resolved without human intervention, and on-time delivery improvement are the commercial KPIs — not dashboard utilization or alert volume
Trend #13 — Blockchain, Distributed Ledger & Trade Document Automation

WHY THIS EXISTS
International trade relies on documents — bills of lading, letters of credit, certificates of origin, phytosanitary certificates, dangerous goods declarations — that are still largely paper-based, manually processed, and fraudulently altered. The ICC estimates that 45 million paper bills of lading are issued annually, with processing costs of $6-8 billion. Blockchain and distributed ledger technology creates a single, immutable, shared record of trade transactions that all parties — shipper, carrier, port, customs, bank — can access simultaneously. Electronic Bills of Lading (eBL) are now legally recognized in 94 countries following the UNCITRAL Model Law on Electronic Transferable Records. TradeLens (discontinued) proved the concept; GSBN, essDOCS, and Wave are proving the commercial model.
BUSINESS IMPACT
• Electronic bills of lading reduce transit document processing time from 5-7 days to hours — directly reducing demurrage costs and improving working capital for every party in the trade transaction
• Blockchain-based trade provenance creates immutable product history from origin to destination — enabling EU Digital Product Passport compliance, anti-counterfeiting verification, and sustainability certification that buyers and regulators require
• Trade finance fraud — historically a $50B+ annual problem driven by paper document manipulation — is structurally reduced when the document cannot be altered after issuance and all parties access the same authenticated record simultaneously
STRATEGIC IMPLICATIONS
• Mandate eBL adoption with top carriers and trade lane partners: the technology is mature, the legal framework exists in 94 countries, and every paper BL still in use is a cost and risk that eBL eliminates
• Integrate digital trade documentation with customs pre-clearance systems: the same electronic document that replaces the paper BL should feed directly into customs declaration systems — build the integration from day one
• Evaluate trade finance digitization alongside documentation: blockchain-enabled dynamic discounting (early payment in exchange for invoice data sharing) creates working capital improvement that funds the technology investment
Trend #14 — IoT-Driven Asset Tracking, Cold Chain Intelligence & Cargo Integrity

WHY THIS EXISTS
IoT sensor deployment in logistics is accelerating across three primary use cases: asset tracking (containers, trailers, pallets, high-value cargo), cold chain monitoring (temperature, humidity, shock, light exposure throughout the cold chain), and cargo integrity (tamper detection, seal integrity, handling violation detection). The cold chain application has the highest direct commercial value: the global cold chain logistics market exceeds $350B annually, and cold chain failures cost the pharmaceutical and food industries billions in product loss and regulatory non-compliance annually. IoT cold chain sensors providing continuous temperature monitoring with automated alerting have reduced pharmaceutical cold chain failures by 40-60% in documented deployments.
BUSINESS IMPACT
• Cold chain IoT reduces pharmaceutical product loss from temperature excursion by 40-60% while providing the regulatory documentation required for GDP (Good Distribution Practice) compliance — the regulatory compliance benefit alone justifies the investment for pharmaceutical logistics operators
• Real-time container tracking reduces “where is my container” inquiry volume by 70-90%, directly reducing customer service labor while improving customer satisfaction — a structural improvement in a cost-intensive customer service function
• High-value cargo IoT (luxury goods, electronics, pharmaceuticals) creates chain-of-custody evidence that reduces insurance premiums and provides the documentation required for cargo insurance claims resolution
STRATEGIC IMPLICATIONS
• Define your cold chain monitoring requirements by product category and regulatory jurisdiction before selecting IoT hardware: pharmaceutical GDP requirements, food HACCP documentation standards, and regulatory evidence requirements differ by geography and are non-negotiable
• Integrate IoT data streams with predictive analytics: the temperature data that prevents a cold chain failure is only as valuable as the alert that triggers human intervention before the threshold is breached — the alert logic and escalation protocol are as important as the sensor hardware
• Build the data retention and audit trail infrastructure for IoT data from day one: regulatory bodies and insurance companies require historical data, not just current sensor readings — the data architecture must support multi-year retention with query capability
Meta-Force 4: The Geopolitics of Movement — Trade Architecture Under Permanent Stress
Trend Summary
Trend Deep-Dives
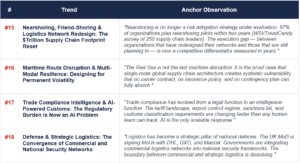
Trend #15 — Nearshoring, Friend-Shoring & Logistics Network Redesign: The $Trillion Supply Chain Footprint Reset

WHY THIS EXISTS
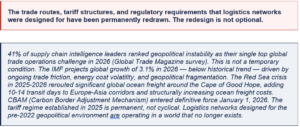
HSBC Global Trade Pulse 2025: 83% of global businesses pursuing nearshoring, 77% planning to reshore significant supply chain capacity. Mexican manufacturing exports to the United States surged approximately 15% in recent quarters as companies leverage USMCA to circumvent trans-Pacific tariffs (Wiima Logistics). North African and Eastern European hubs are becoming the equivalent Mexico for EU-serving supply chains. The challenge identified across all research: nearshoring reduces one set of risks while creating others — fragmented sourcing networks, higher unit costs, and the need for more sophisticated demand sensing and multi-node orchestration to manage a more complex network.
BUSINESS IMPACT
• Nearshored supply chains reduce tariff exposure and lead times but increase per-unit production costs 15-30% in most manufacturing categories — the economics require either higher realized selling price, lower operational cost, or both to close the gap
• The logistics infrastructure gap in nearshoring destinations is the execution constraint most organizations underestimate: Mexico, Eastern Europe, and North Africa have improving infrastructure but still lack the port capacity, warehouse density, and carrier network depth of established manufacturing hubs like Guangdong
• Organizations that completed initial nearshoring in 2022-2023 are 18-36 months ahead on operational optimization — a compounding advantage as they iterate on the nearshored network while later movers are still executing the initial transition
STRATEGIC IMPLICATIONS
• Map your supply chain tariff exposure by SKU, country of origin, and HS code classification — the product-level tariff model is the foundation of the network redesign decision, and most organizations do not have this analysis completed
• Evaluate Mexico (USMCA-advantaged), Vietnam, and India as the three primary nearshoring destinations for US-serving supply chains, and Eastern Europe (Poland, Czech Republic, Romania) plus North Africa (Morocco, Egypt) for EU-serving supply chains — the infrastructure and labor cost profiles differ significantly across these options
• Design the logistics network for the nearshored configuration before executing the manufacturing move: the warehouse locations, carrier relationships, customs brokerage capability, and last-mile infrastructure in the nearshoring destination must be validated before the manufacturing investment is committed
Trend #16 — Maritime Route Disruption & Multi-Modal Resilience: Designing for Permanent Volatility

WHY THIS EXISTS
The Red Sea disruption in 2025-2026 has rerouted significant global ocean freight around the Cape of Good Hope, adding 10-14 days to Europe-Asia corridors and increasing voyage costs by 15-25% on affected routes. Maersk, MSC, and CMA CGM are deploying divergent strategies — some switching to Cape route, some resuming limited Suez transits. The structural lesson is consistent across every maritime disruption: Suez Canal, Panama Canal low water levels, Bab el-Mandeb, Taiwan Strait — global trade is concentrated through a small number of maritime choke points, each of which represents a systemic risk that cannot be hedged by individual carriers or shippers.
BUSINESS IMPACT
• Cape route rerouting from Suez adds 10-14 days of transit time and 15-25% additional voyage cost to Europe-Asia freight — costs that concentrate in consumer pricing, carrier margins, and shipper inventory carrying costs
• Multi-modal resilience (ocean + air + rail alternatives with pre-negotiated capacity) is now a commercial necessity: the organizations that had pre-established air freight relationships and Trans-Siberian rail alternatives in early 2025 absorbed the Red Sea disruption at a fraction of the cost of those that were forced to the spot market
• Inland waterway and pan-Eurasian rail (China-Europe freight trains) are gaining strategic importance as ocean freight alternatives: China-Europe rail volumes grew significantly during the Red Sea disruption and are maintaining elevated share as shippers diversify modal exposure
STRATEGIC IMPLICATIONS
• Map your supply chain’s maritime choke-point concentration: what percentage of your freight volume passes through Suez, Panama, or Bab el-Mandeb in a normal year? The answer defines your systemic disruption exposure
• Pre-negotiate emergency capacity agreements with air freight carriers, pan-Eurasian rail operators, and alternative ocean routing options before the next disruption occurs — spot market access during a disruption is priced at 3-5x normal rates
• Develop a multi-modal routing playbook by trade lane: for each major trade corridor, define the alternative routing options, their cost differential, their transit time impact, and the trigger conditions under which you activate each
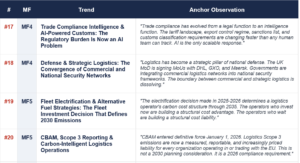
Trend #17 — Trade Compliance Intelligence & AI-Powered Customs: The Regulatory Burden Is Now an AI Problem

WHY THIS EXISTS
US tariffs on Chinese imports reached up to 145% in 2025. Mexico announced new tariffs of up to 50% on 1,400+ industrial products. BIS 50% Rule enforcement expands November 2026. The sanctions and export control environment is the most complex in post-WWII history. AI-powered trade compliance systems (automated HS code classification, denied party screening, sanctions monitoring, tariff optimization through classification review) are reducing compliance cost and audit risk simultaneously. WTO: AI could reduce costs associated with logistics regulatory compliance by 40% by 2040. The compliance burden is not decreasing — but the cost of managing it is declining for organizations that have deployed AI compliance intelligence.
BUSINESS IMPACT
• AI-powered HS code classification reduces tariff misclassification errors by 40-60% — every misclassification is a potential audit, a potential penalty, and a potential customs delay that disrupts delivery commitments
• Denied party screening AI (continuous monitoring of 200+ government lists, 24/7) replaces periodic manual screening that inherently misses changes between review cycles — the regulatory risk of manual screening is existential in the current sanctions environment
• Tariff optimization through intelligent classification review (identifying legal reclassification opportunities that reduce duty liability) is generating documented ROI of 3-8% of tariff spend in professional advisory deployments — AI is extending this to organizations without dedicated trade advisory teams
STRATEGIC IMPLICATIONS
• Audit your customs classification accuracy against AI-reclassification analysis: most organizations find 10-20% of their HS code classifications are defensible but suboptimal — the tax savings from optimization often fund the AI compliance investment entirely
• Implement continuous denied party screening as a non-negotiable: any organization with cross-border trade relationships that is screening less than daily is operating with sanctions exposure that no compliance program can defend
• Build trade compliance data infrastructure before geopolitical disruptions require rapid sourcing changes: the ability to quickly assess tariff exposure for a new supplier country requires the same product-level tariff model that network redesign decisions require
Trend #18 — Defense & Strategic Logistics: The Convergence of Commercial and National Security Networks

WHY THIS EXISTS
Global defense spending is at its highest level since the Cold War. The UK Ministry of Defence has signed Memoranda of Understanding with DHL Supply Chain, GXO, Maersk, and Serco to explore how civilian logistics can be mobilized during national crises. South Korea is allocating 4.5 trillion won ($3.1B) to expand its global ports and logistics network as a supply chain security strategy. Increased global defense spending is creating new revenue opportunities for logistics service providers with the right capabilities and security clearances. The convergence is structural: governments have recognized that civilian logistics infrastructure is national strategic infrastructure.
BUSINESS IMPACT
• Defense logistics contracts provide stable, high-margin revenue streams with long-term commitment — a structural diversification for logistics providers exposed to cyclical commercial freight markets
• Security clearance and compliance requirements for defense logistics create a significant barrier to entry that favors established operators with existing government relationships and proven security infrastructure
• The dual-use nature of logistics infrastructure (commercial and defense) creates resilience arguments for government investment in civilian logistics modernization that previously did not exist — logistics providers can now access infrastructure funding streams that were previously unavailable
STRATEGIC IMPLICATIONS
• Evaluate your organization’s capability to meet defense logistics requirements: security clearance processes, chain-of-custody documentation standards, and operational continuity requirements differ significantly from commercial logistics — the assessment is the starting point
• Develop relationships with defense procurement authorities in your primary operating geographies before specific contract opportunities arise — defense logistics relationships are built over years, not won in procurement cycles
• Assess the dual-use value of your infrastructure investments: port capacity, cold chain capability, and secure warehousing that serve commercial customers during peacetime serve defense requirements during mobilization — the dual-use framing strengthens the investment case for both commercial and government stakeholders
Meta-Force 5: Green Logistics — Decarbonization as a Commercial and Regulatory Imperative
Trend Summary
Trend Deep-Dives
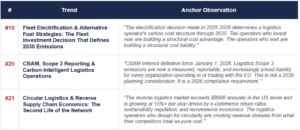
Trend #19 — Fleet Electrification & Alternative Fuel Strategies: The Fleet Investment Decision That Defines 2030 Emissions

WHY THIS EXISTS
Electric vehicle deployment in commercial fleet is accelerating: Mercedes eActros, Volvo FH Electric, and DAF XF Electric are commercially available for short-to-medium haul operations. Amazon has committed to 100,000 Rivian electric delivery vans. DHL is deploying electric vehicles across urban last-mile networks globally. Hydrogen fuel cell trucks (Nikola, Hyundai XCIENT) are entering operational deployment for heavy long-haul where battery weight limitations constrain EV economics. The EU’s FuelEU Maritime regulation and alternative fuel infrastructure mandates are reshaping maritime propulsion economics simultaneously. Carbon pricing under CBAM and the EU ETS is making alternative fuel investment financially rational independent of sustainability commitments.
BUSINESS IMPACT
• Electric delivery vehicles in urban last-mile achieve total cost of ownership parity with diesel equivalents in 2026 in most European markets, and approach parity in US dense urban markets — the financial case is no longer solely a sustainability argument
• CBAM creates direct financial pressure on imported goods with high embedded carbon: shippers who cannot demonstrate low-carbon logistics for their EU-imported goods face carbon border adjustment charges that disadvantage them vs. shippers with documented low-carbon supply chains
• Fleet electrification combined with AI route optimization creates a compounding advantage: electric vehicles benefit more from optimized routing than diesel equivalents because range anxiety is real — AI that minimizes distance and maximizes charging efficiency improves both the economics and the operational reliability of electric fleets
STRATEGIC IMPLICATIONS
• Develop a fleet electrification roadmap by vehicle class and operating geography: urban last-mile EVs are commercially viable now; regional middle-mile requires infrastructure investment planning; long-haul is hydrogen or hybrid-diesel through 2028 in most markets
• Build charging infrastructure planning into depot investment decisions immediately: the retrofit cost of adding charging infrastructure to an existing depot is 3-4x the cost of designing it in from the start
• Engage in carbon pricing and CBAM compliance planning now: the carbon cost of your current fleet is a financial liability that can be modeled, quantified, and reduced through a documented transition roadmap
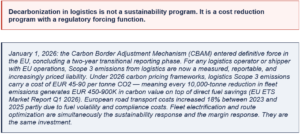
Trend #20 — CBAM, Scope 3 Reporting & Carbon-Intelligent Logistics Operations

WHY THIS EXISTS
The Carbon Border Adjustment Mechanism (CBAM) requires importers of goods into the EU to report and pay for the embedded carbon emissions in their products and supply chains. Logistics Scope 3 emissions (freight transport, warehousing, last-mile) are a significant component of total product carbon footprint — and shippers who cannot document their logistics carbon footprint are disadvantaged in EU market access. The EU ETS carbon price for 2026 is EUR 45-90 per tonne. AI-powered carbon calculation platforms (Pledge, Corelink, EcoTransIT) are providing real-time Scope 3 logistics emissions measurement across all modes and carriers. The intersection of carbon pricing and route optimization creates the “dual savings” opportunity: every fuel optimization simultaneously reduces emissions and reduces direct fuel cost.
BUSINESS IMPACT
• CBAM compliance requires product-level carbon footprint documentation that most shippers do not currently possess — the audit of current state is the first step to understanding the exposure and the data infrastructure investment required to address it
• Carbon-intelligent routing AI that simultaneously optimizes for cost and emissions is delivering 10-15% emissions reduction alongside 10-15% cost reduction — the optimization objectives are aligned, not in tension
• Scope 3 logistics emissions reporting is becoming a customer requirement, not just a regulatory one: enterprise shippers are requesting verified carbon footprint data from logistics providers as part of their own Scope 3 reporting obligations — logistics providers that cannot supply this data are losing business to those that can
STRATEGIC IMPLICATIONS
• Complete a CBAM exposure assessment for all EU import/export flows immediately: which products, which trade lanes, and which logistics operations generate material CBAM liability, and what is the current financial exposure?
• Implement a carbon measurement platform that provides per-shipment emissions data at the mode, carrier, and route level — this is the foundation for both regulatory compliance and commercial differentiation with sustainability-committed customers
• Build carbon reduction into carrier selection criteria: the carrier with the highest sustainability credentials is not always the most expensive choice — and in markets where CBAM is applying a carbon cost, the low-carbon carrier may offer lower total delivered cost despite higher per-tonne-km freight rates
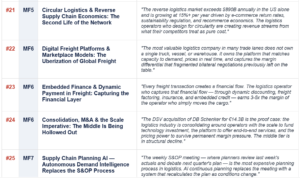
Trend #21 — Circular Logistics & Reverse Supply Chain Economics: The Second Life of the Network

WHY THIS EXISTS
NRF estimates US merchandise returns exceeded $890B in 2024. EU Ecodesign Regulation and Digital Product Passports are creating mandatory infrastructure for structured reverse logistics. The recommerce market (resale, refurbishment, repair) is growing 11x faster than traditional retail. Reverse logistics — the collection, sortation, refurbishment, and redeployment of returned and end-of-life products — is becoming a specialized capability that creates commercial differentiation. GXO Logistics has built reverse logistics as a core service offering. DHL has established a reverse logistics center of excellence. The circular economy regulatory mandate is creating a structural demand increase for reverse logistics capability.
BUSINESS IMPACT
• Returns processing automation (AI-powered condition assessment, automated sortation, refurbishment routing) reduces returns handling cost by 30-50% while improving recovery value — the economic case for reverse logistics investment is now clearly positive at scale
• Recommerce platforms (brand-operated or third-party) require dedicated reverse logistics infrastructure: receiving, authentication, grading, refurbishment, and redeployment logistics that are categorically different from forward logistics operations
• EU Digital Product Passport compliance creates the data infrastructure that enables structured reverse logistics — the same product-level data that proves sustainability credentials also enables condition-specific refurbishment routing and recommerce value optimization
STRATEGIC IMPLICATIONS
• Map your reverse logistics volume by product category and current recovery value: the gap between current recovery value and potential recovery value (with better sortation, refurbishment, and recommerce routing) is the business case for reverse logistics investment
• Develop or partner on recommerce capability for your top return volume categories — the recommerce revenue stream is a direct offset to returns processing cost, and the first movers in category-specific recommerce logistics are establishing the relationships and capabilities that will be difficult for later entrants to replicate
• Build reverse logistics data collection into returns processes from day one: condition assessment data, return reason data, and refurbishment cost data are the inputs to the recovery value optimization AI that makes circular logistics commercially rational
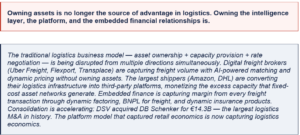
Meta-Force 6: Platform Economics & Logistics-as-a-Service: The Business Model Revolution
Trend Summary
Trend Deep-Dives
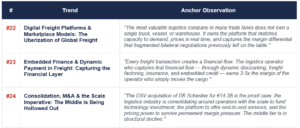
Trend #22 — Digital Freight Platforms & Marketplace Models: The Uberization of Global Freight

WHY THIS EXISTS
Digital freight brokerage is growing at 15-20% annually while traditional brokerage is flat. Uber Freight, C.H. Robinson Navisphere, Transplace (now Uber Freight), and Flexport are deploying AI-powered freight matching that reduces transaction cost, improves capacity utilization, and provides real-time rate transparency. The platform effect: more shippers attract more carriers, more carriers improve fill rates, better fill rates attract more shippers. C.H. Robinson processes 18 million+ shipments annually through its Navisphere platform — generating the data density required for AI pricing models that no individual carrier or broker can replicate.
BUSINESS IMPACT
• Digital freight platforms are reducing spot market transaction costs by 30-50% through AI-powered matching that eliminates the manual negotiation cycle between shippers and carriers — compressing a 4-8 hour process to minutes
• Real-time capacity visibility (knowing exactly where committed carrier capacity is and where spot capacity exists at any moment) enables dynamic load planning that improves asset utilization by 15-25% across shipper and carrier simultaneously
• Platform data on freight transactions is a strategic asset: pricing intelligence, capacity trends, lane performance benchmarks, and carrier reliability data are all more valuable than the transaction they originated from — and platforms that own this data own a durable competitive advantage
STRATEGIC IMPLICATIONS
• Evaluate your freight procurement model against digital platform capabilities: the combination of AI-powered matching, dynamic pricing, and real-time visibility offered by digital freight platforms may outperform dedicated contract carrier relationships for certain lane types and volume profiles
• Build data sharing agreements with digital freight platforms: platforms that have your historical shipment data, lane requirements, and service level specifications generate better rates and better capacity matches than those serving you as an anonymous transaction
• Assess the platform economics opportunity in your own business: if you manage freight for multiple clients or operate a logistics network with excess capacity, the platform model (technology-enabled capacity orchestration for third parties) may be more valuable than the asset model
Trend #23 — Embedded Finance & Dynamic Payment in Freight: Capturing the Financial Layer

WHY THIS EXISTS
The embedded finance opportunity in logistics is significant and largely uncaptured by traditional logistics operators. Freight factoring (advancing payment to carriers against invoices) is a $200B+ annual market in the US alone. Dynamic discounting (offering early payment in exchange for a discount) creates working capital benefit for shippers while generating margin for logistics platforms with the financial infrastructure. Insurance (cargo insurance, trade credit insurance, freight liability insurance) embedded directly into the freight booking flow is a high-margin product adjacent to every transaction. Flexport, Uber Freight, and Maersk are building or acquiring embedded finance capabilities as margin diversification strategies.
BUSINESS IMPACT
• Freight factoring embedded in digital freight platforms captures 2-4% of invoice value as a financial service margin — on a $10B annual freight platform, this represents $200-400M in high-margin financial revenue from the same transaction volume
• Dynamic insurance pricing (cargo insurance priced in real time based on route, carrier, commodity, and weather data) creates a product that is more fairly priced for shippers and more profitable for the underwriter than traditional blanket cargo insurance
• Logistics-embedded BNPL (Buy Now Pay Later for freight) addresses a genuine SME shipper need: the ability to commit capacity for Q4 peak without the working capital required to pay for it in Q3 — a financial product that creates loyalty and platform stickiness simultaneously
STRATEGIC IMPLICATIONS
• Assess the financial services opportunity within your existing customer relationships: which customers would benefit from freight factoring (carriers with long invoice cycles), dynamic discounting (shippers with cash-rich balance sheets), or embedded insurance (shippers of high-value or temperature-sensitive cargo)?
• Evaluate partnership with specialist freight finance providers before building proprietary capability: the regulatory requirements for financial services are significant, and partnerships with established freight financiers can capture the margin opportunity without the regulatory investment
• Build embedded finance into your digital platform architecture from day one: financial products that require customers to leave the logistics platform to access a finance provider capture only a fraction of the value that fully embedded, single-workflow financial services capture
Trend #24 — Consolidation, M&A & the Scale Imperative: The Middle Is Being Hollowed Out

WHY THIS EXISTS
DSV acquired DB Schenker from Deutsche Bahn in 2024 for €14.3B — the largest logistics acquisition in history. CMA CGM acquired CEVA Logistics, creating an integrated ocean carrier + logistics operator. Maersk has spent $10B+ on logistics acquisitions since 2019. The consolidation logic is consistent: scale enables technology investment; technology enables end-to-end service capability; end-to-end capability commands premium pricing; premium pricing enables more technology investment. The circular advantage compounds for those with the initial scale. FTI Consulting 2026: “Operators with scale, technology capabilities, and pricing sophistication will accelerate acquisition strategies. Distressed or under-optimized carriers may become targets as capital costs rise.”
BUSINESS IMPACT
• The minimum viable scale for competing as a global integrated logistics provider is rising rapidly: the technology investment required for AI orchestration, control tower capabilities, autonomous delivery, and embedded finance is only economically rational at scale that most regional operators cannot achieve independently
• Mid-tier consolidation is accelerating in every logistics segment: LTL carriers, freight brokers, contract logistics providers, and freight forwarders are all seeing the same dynamic — acquirer premiums for operators with technology differentiation; distressed valuations for operators without it
• Private equity is the consolidation vehicle for the mid-market: PE-backed roll-up strategies in logistics are creating regional champions with sufficient scale to invest in technology and compete for shippers that smaller operators cannot serve profitably
STRATEGIC IMPLICATIONS
• Define your scale thesis explicitly: are you building to the scale required to compete as a full-service integrated logistics provider, or specializing in a specific segment, geography, or commodity where niche expertise creates defensible differentiation?
• Evaluate M&A as a growth and capability acquisition strategy with the same rigor as organic investment: the technology capabilities and customer relationships acquired through M&A may be faster and cheaper to acquire than to build organically in a rapidly consolidating market
• Build integration capability before executing acquisitions: M&A value in logistics is destroyed in integration, not in deal execution — operators with proven integration playbooks (systems consolidation, culture alignment, network optimization) capture more value per acquisition than those learning integration while executing it
The Logistics Value Chain: Eight Segments, Eight AI Transformations

The following analysis maps the AI transformation across each of the eight primary segments of the logistics value chain. For each segment, three distinct layers are examined: the current operating state, the AI innovation being deployed, and the AI-first process design — what the segment looks like when redesigned from first principles around AI decision-making, not when AI is added on top of an existing process.

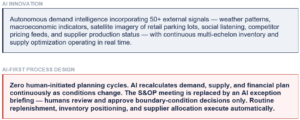
Segment 1: Supply Chain Planning & Demand Intelligence
Trend 25
CURRENT STATE
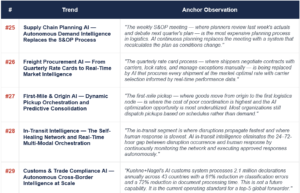
Weekly or monthly S&OP cycles. Statistical demand forecasting with 2-4 week horizon. Manual data aggregation consuming 60-80% of the planning cycle. Consensus-building across functions through meetings, spreadsheets, and escalation chains.
MARKET EVIDENCE
• FedEx digital twin simulates 14 million scenarios daily to anticipate supply chain disruptions — the most precisely documented example of continuous AI supply chain planning at commercial scale (FedEx Technology Report 2025)
• Blue Yonder VP Ann Marie Jonkman: “Agentic systems will automate planning and sourcing in 2026. The most transformative use case will be autonomous end-to-end replenishment” (Inbound Logistics January 2026)
• Microsoft Supply Chain 2.0 targets deployment of 100+ supply chain AI agents by end of 2026 across its own and customer supply chains — embedding AI across demand sensing, supply allocation, and logistics orchestration simultaneously
• McKinsey: AI demand sensing combining 50+ external signals with internal data reduces forecast error 30-50% vs. statistical methods — with corresponding inventory carrying cost and stockout rate improvements

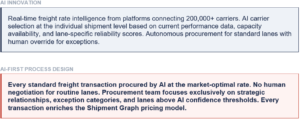
Segment 2: Freight Procurement & Rate Intelligence
Trend 26
CURRENT STATE
Quarterly or annual rate negotiations with preferred carriers. Manual spot market procurement. Rate cards updated on fixed cycles with limited real-time market intelligence. Carrier selection based on historical relationships and experience rather than current performance data.
MARKET EVIDENCE
• Project44 AI Freight Procurement Agent operates on a logistics data graph connecting 259,000 carriers and 1.5 billion shipments annually across 186 countries — the largest documented carrier intelligence network in commercial operation (Supply & Demand Chain Executive, February 2026)
• C.H. Robinson Navisphere processes 18 million+ shipments annually — every transaction enriching a pricing model that no individual shipper or forwarder can replicate from their own data alone
• Uber Freight CTO Val Marchevsky: “The biggest opportunities come from using AI to redesign processes for efficiency — not from layering AI onto broken processes” (2026)
• AI carrier selection at the transaction level improves on-time delivery performance 8-15% vs. allocation-based carrier assignment — directly reducing the penalty costs, re-delivery expenses, and customer satisfaction impact of late freight

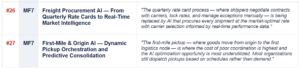
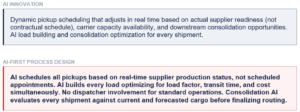
Segment 3: First-Mile & Origin Logistics
Trend 27
CURRENT STATE
Scheduled pickup routes with limited dynamic adjustment. Manual load building based on dispatcher experience. Consolidation decisions made by rule-of-thumb with limited visibility into downstream capacity or demand.
MARKET EVIDENCE
• Dynamic pickup scheduling AI reduces empty miles at the first-mile stage by 12-18% — the segment with the highest ratio of unoptimized capacity in the logistics network because it is the most fragmented
• AI load building and consolidation optimization increases average load factor 8-15% vs. experience-based manual consolidation — reducing the number of vehicles required for equivalent freight volume
• Predictive first-mile incorporating supplier ERP production data reduces dwell time and emergency freight spend by coordinating pickup with actual product readiness rather than contractual schedule
• McKinsey: AI-driven route optimization reduces logistics costs approximately 15% — first-mile represents the segment where this improvement is most concentrated due to the inefficiency of traditional schedule-based dispatch

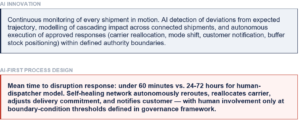
Segment 4: In-Transit Intelligence
Trend 28
CURRENT STATE
Fixed schedules with reactive exception handling. Batch TMS status updates. Human dispatchers manage disruptions through manual identification, escalation, and rerouting — with a 24-72 hour response lag from disruption occurrence to action.
MARKET EVIDENCE
• Ziegler Group: “Self-healing supply chains use AI agents to renegotiate freight rates, reroute shipments in real-time during port closures, or adjust inventory levels without human intervention” — deploying this capability in 2026 operations (Ziegler 2026)
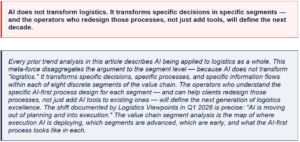
• Logistics Viewpoints Q1 2026: “AI is now being applied within execution environments — transportation routing, inventory rebalancing, exception management — representing a meaningful transition from advisory to execution AI”
• Red Sea disruption 2025-2026: organizations with self-healing in-transit AI absorbed the disruption at a fraction of the cost of those relying on human dispatcher response — the difference was not technology capability but organizational deployment decision
• In-transit carbon optimization: AI dynamically adjusts routing and carrier selection to minimize emissions while maintaining delivery commitments — every route change is simultaneously a carbon reduction and a cost optimization

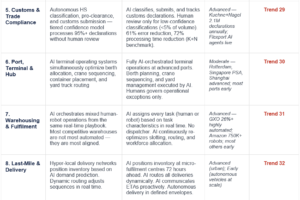
Segment 5: Customs & Trade Compliance
Trend 29
CURRENT STATE
Manual HS code classification. Batch customs submission. Reactive to holds and queries. Customs broker labor-intensive at every submission. Organizations losing $600B+ annually to logistics documentation data entry errors (IBM / Data Warehousing Institute).
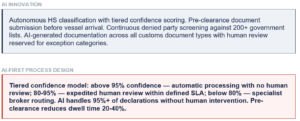
MARKET EVIDENCE
• Kuehne+Nagel AI customs system processes 2.1 million declarations annually across 43 countries. Results: 61% reduction in classification errors, 72% reduction in document processing time. Tiered confidence scoring: above 95% automatic processing, 80-95% expedited human review, below 80% specialist broker (Kuehne+Nagel Digital Logistics Report 2025)
• Organizations lose $600B+ annually to logistics documentation data entry errors alone — IBM / Data Warehousing Institute. AI document processing eliminates this cost at source, not through error remediation downstream
• 78% of logistics companies lack contractual clarity on AI accountability in multi-party customs operations (WEF Supply Chain Governance Report 2025) — the governance gap is the implementation constraint, not the technology
• Flexport AI agents are designed to manage customs and prepare for potential refunds, cut supply chain costs, and remove friction from global trade (Supply & Demand Chain Executive, February 2026)

Segment 6: Port, Terminal & Hub Operations
Trend 30
CURRENT STATE
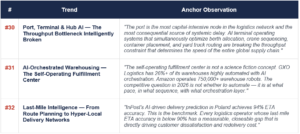
Human-dispatched crane and yard operations. Sequential optimization of berth, crane, and yard as separate processes. Manual pre-arrival documentation processing. Terminal operating systems updated in batch cycles rather than real time.
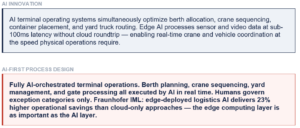
MARKET EVIDENCE
• Automated port terminals achieve 30-50% higher throughput per berth vs. conventional terminals with 24/7 operation — directly absorbing the capacity surges that Red Sea rerouting has created at European ports (ARC Advisory 2026)
• Rotterdam, Singapore PSA, and Shanghai are deploying AI terminal operating systems with edge computing infrastructure processing sensor and video data on-premise at sub-100ms response time
• Fraunhofer IML Logistics AI Report 2025: edge-deployed logistics AI delivers 23% higher operational savings than cloud-only approaches — the edge computing investment is the infrastructure requirement that most port AI programs underestimate
• Red Sea rerouting has increased European port volumes beyond planned capacity. AI terminal management is the only mechanism capable of absorbing demand surges without proportional infrastructure investment in new berths or cranes

Segment 7: Warehousing & Fulfillment
Trend 31
CURRENT STATE
Rules-based WMS for pick-and-pack. Batch replenishment cycles. Human dispatcher coordinates robot and human workflows separately, creating coordination gaps and throughput losses between human and automated zones.
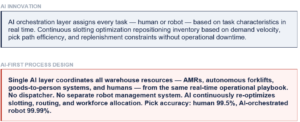
MARKET EVIDENCE
• Logistics Viewpoints Q1 2026: “The most competitive warehouses will not necessarily be the most automated; they will be the most aligned — where people, systems, and machines operate from the same real-time playbook”
• GXO Logistics: 26%+ of warehouses highly automated with AI orchestration — the leading benchmark for 3PL warehouse automation at commercial scale, with documented throughput and accuracy improvements (GXO Annual Report 2025)
• Amazon operates 750,000+ warehouse robots globally — the largest deployed base of warehouse automation in existence, entirely AI-orchestrated through Amazon Robotics proprietary control systems
• Microsoft-KUKA Azure integration: Azure AI services cut robot programming time for simple tasks by 80% — demonstrating that AI orchestration reduces the cost and time of physical automation deployment, not just its efficiency once deployed (Microsoft Supply Chain 2.0, March 2026)

Segment 8: Last-Mile Delivery
Trend 32
CURRENT STATE
Fixed morning-dispatch routing with static delivery sequences. Reactive redelivery management. End-of-day delivery confirmation. Static customer ETAs communicated at shipment booking with no dynamic update through the delivery day.
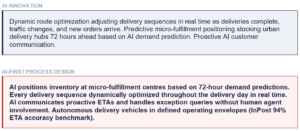
MARKET EVIDENCE
• InPost AI-driven delivery prediction in Poland: 94% ETA accuracy — setting the 2026 competitive benchmark for last-mile delivery intelligence across Europe. Organizations below 85% ETA accuracy have a measurable, closeable gap with direct NPS and redelivery cost implications (InPost Annual Report 2025)
• Drone delivery economics: EUR 1.20-2.50 per delivery vs. EUR 4-8 for human last-mile in comparable operating contexts — a 2-5x cost advantage in rural/suburban low-density routes, healthcare urgent delivery, and high-value parcel segments (Wing / Starship documented deployments)
• Ziegler Group: “Micro-fulfillment centers and urban dark stores use AI to position high-demand products closer to consumers, reducing both lead times and emissions” — the predictive positioning model is actively deployed in 2026 operations
• nuVizz: last-mile AI yields tighter route plans with better density, on-time gains, and mileage reduction where data pipelines and processes are in place. The constraint is data quality and integration, not AI model capability (Inbound Logistics January 2026)

Meta-Force 7: The AI-First Logistics Value Chain — Eight Segments, Eight Transformations
Trend Summary
Trend Deep-Dives
Trend #25 — Supply Chain Planning AI — Autonomous Demand Intelligence Replaces the S&OP Process

WHY THIS EXISTS
Blue Yonder VP Ann Marie Jonkman (Inbound Logistics, January 2026): “Agentic systems will automate planning and sourcing in 2026. The most transformative use case will be autonomous end-to-end replenishment.” The S&OP process — monthly or quarterly cycles of manual data aggregation, stakeholder review, and consensus-building — is being replaced by AI systems that run demand sensing continuously, incorporating 50+ external signals (weather, macroeconomic indicators, social listening, competitor pricing, satellite imagery of retailer parking lots) alongside internal data. Microsoft’s Azure supply chain stack targets over 100 AI agents deployed across supply chain functions by end of 2026. The shift is from plan → execute → react to sense → decide → execute → learn — a continuous loop with no human-initiated planning cycles.
BUSINESS IMPACT
• Demand sensing AI combining internal POS data with 50+ external signals is reducing forecast error by 30-50% vs. statistical methods alone — with corresponding reductions in safety stock, stockouts, and emergency freight spend
• Continuous S&OP replaces quarterly planning cycles with real-time plan updates: inventory rebalancing, supplier allocation adjustments, and production plan changes execute based on AI recommendations without waiting for the next S&OP meeting
• FedEx’s supply chain digital twin simulates 14 million scenarios daily to anticipate disruptions — the most advanced documented example of continuous AI planning at commercial scale
STRATEGIC IMPLICATIONS
• Audit your current S&OP process: how many hours per cycle are spent on data aggregation vs. decision-making? The ratio determines how much value continuous AI planning creates — organizations spending 80% of S&OP time on data assembly capture the most immediate AI value
• Define the human-in-the-loop boundary for autonomous replenishment: which SKU categories, volume thresholds, and exception conditions require human approval before AI executes a replenishment decision
• Build the external signal library before deploying demand sensing AI: the AI is only as good as its input signals — organizations that curate 30-50 relevant external signals outperform those relying on internal data alone by 2-3x in forecast accuracy improvement
Trend #26 — Freight Procurement AI — From Quarterly Rate Cards to Real-Time Market Intelligence

WHY THIS EXISTS
Project44’s AI Freight Procurement Agent operates on a logistics data graph connecting more than 259,000 carriers and 1.5 billion shipments annually across 186 countries — giving it carrier performance intelligence that no individual shipper or forwarder can replicate. AI freight procurement eliminates the information asymmetry that previously favored carriers in rate negotiations: shippers with AI tools know what the market is clearing at before they negotiate. Uber Freight CTO Val Marchevsky (2026): “The biggest opportunities come from using AI to redesign processes for efficiency.” Freight procurement is the process with the largest redesign opportunity — it sits at the intersection of the Shipment Graph advantage and the rate intelligence gap between AI-enabled and manual operators.
BUSINESS IMPACT
• AI carrier selection at the transaction level — selecting the optimal carrier for each shipment based on real-time performance data, capacity availability, and lane-specific reliability — improves on-time performance by 8-15% vs. allocation-based carrier assignment
• Dynamic rate intelligence from platforms connecting 259,000+ carriers enables shippers to identify when contracted rates are above or below market — directly informing renegotiation strategy and spot market participation decisions
• Autonomous procurement for standard lanes (the 80% of freight that fits predictable parameters) frees procurement teams to focus on exception categories, strategic partnerships, and the 20% of freight that genuinely requires human judgment
STRATEGIC IMPLICATIONS
• Identify your highest-volume, most standardized freight lanes and evaluate AI-autonomous procurement for those lanes first: the predictability and volume density make them ideal for autonomous carrier selection with immediate measurable ROI
• Connect your TMS to a visibility platform with 200,000+ carrier connections before deploying AI procurement: the AI selection quality is bounded by the carrier data quality it has access to
• Measure freight procurement AI in commercial terms: rate per lane per period vs. market benchmark, carrier on-time performance, and empty miles reduction — not procurement process efficiency
Trend #27 — First-Mile & Origin AI — Dynamic Pickup Orchestration and Predictive Consolidation

WHY THIS EXISTS
First-mile logistics represents 15-20% of total supply chain cost for most shippers, but receives a fraction of the technology investment allocated to last-mile and in-transit operations. AI-powered first-mile optimization coordinates pickup scheduling, consolidation decisions, and load building in real time — incorporating demand signals, carrier capacity, traffic conditions, and dock availability simultaneously. Dynamic pickup orchestration that adjusts schedules in real time reduces empty miles by 12-18% in documented deployments. AI consolidation optimization that evaluates every shipment against current and forecasted loads at the origin point increases load factor and reduces per-unit freight cost.
BUSINESS IMPACT
• Dynamic pickup scheduling AI reduces empty miles at the first-mile stage by 12-18% — the first-mile stage has the highest ratio of unoptimized capacity of any segment in the logistics network because it is the most fragmented and variable
• AI load building and consolidation optimization increases average load factor by 8-15% vs. experience-based manual consolidation — directly reducing the number of vehicles required for equivalent freight volume
• Predictive first-mile: AI that incorporates supplier production schedules, customs release predictions, and carrier capacity constraints to schedule pickup at the optimal moment (not the contractually scheduled moment) reduces dwell time and expedited freight spend
STRATEGIC IMPLICATIONS
• Audit first-mile pickup utilization: what percentage of pickups are on schedule vs. optimal timing? The gap is the AI first-mile opportunity — and most organizations find 20-30% of first-mile pickups would be better timed if AI were coordinating pickup with real-time supplier, carrier, and consolidation data
• Build API connectivity between your TMS and supplier production systems: first-mile AI cannot optimize pickup timing without knowing when goods will actually be ready, not just when they are scheduled to be ready
• Define the consolidation intelligence rules before deploying AI: which cargo types consolidate, which cannot, what are the customs co-loading restrictions, and which service commitments require direct routing — the rules are the AI operating boundaries
Trend #28 — In-Transit Intelligence — The Self-Healing Network and Real-Time Multi-Modal Orchestration

WHY THIS EXISTS
Logistics Viewpoints Q1 2026 confirms the defining shift: “AI is moving out of planning and into execution.” In-transit AI is the execution layer — systems that monitor every shipment in motion, detect deviations from expected trajectory, model cascading impact across connected shipments, and execute approved responses (carrier reallocation, mode shift, customer notification, forward positioning of buffer stock) without waiting for a human dispatcher to identify the problem. The Ziegler Group describes these as “self-healing supply chains” that use AI agents to renegotiate freight rates and reroute shipments in real time during port closures. The commercial value: organizations with self-healing in-transit networks absorb the Red Sea disruption at a fraction of the cost absorbed by those relying on human response.
BUSINESS IMPACT
• Self-healing in-transit AI reduces mean time to disruption response from 24-72 hours (human dispatcher identification + escalation + decision + execution) to under 60 minutes — directly reducing emergency freight premium and missed delivery rates
• Real-time multi-modal optimization during transit: AI that continuously evaluates the economics of completing a journey by the booked mode vs. switching (e.g., ocean to air for time-critical cargo) against current rate differentials and delivery commitment values captures the mode-switch opportunity before it closes
• In-transit carbon optimization: AI that adjusts routing, speed, and carrier selection dynamically to minimize emissions while maintaining delivery commitments — directly reducing CBAM-applicable emissions in a measurable, documented way that satisfies Scope 3 reporting requirements
STRATEGIC IMPLICATIONS
• Build real-time in-transit visibility as the prerequisite: AI that cannot see every shipment in motion cannot detect deviations or model cascading impact — the visibility investment is the prerequisite for in-transit AI, not a separate initiative
• Define the autonomous response boundaries: which disruption types trigger autonomous rerouting (AI executes without human approval), which trigger AI recommendation with human approval, and which trigger immediate escalation to a human manager
• Integrate customer notification into in-transit AI from day one: the commercial value of early disruption detection is only realized if that knowledge is used to notify customers proactively — organizations that notify before customers ask dramatically outperform those that notify reactively on NPS
Trend #29 — Customs & Trade Compliance AI — Autonomous Cross-Border Intelligence at Scale

WHY THIS EXISTS
International trade documentation is simultaneously the most labor-intensive, most error-prone, and most commercially consequential process in cross-border logistics. Organizations lose $600B+ annually to data entry errors across logistics documentation (IBM / Data Warehousing Institute). A single customs hold can cost $50,000-200,000 per day in demurrage and downstream disruption. Kuehne+Nagel’s tiered confidence AI — above 95% confidence for automatic processing, 80-95% for expedited human review, below 80% for specialist broker routing — represents the production model for autonomous customs at scale. Flexport’s AI agents are designed to manage customs and prepare for potential refunds. The WEF 2025 Supply Chain Governance Report finding adds urgency: 78% of logistics companies lack contractual clarity on AI accountability in multi-party customs operations — creating unacknowledged governance risk at the precise point of highest regulatory exposure.
BUSINESS IMPACT
• Kuehne+Nagel documented: 61% reduction in customs classification errors, 72% reduction in document processing time — the most precisely documented AI logistics ROI in any publicly available operator report
• AI pre-clearance reduces customs dwell time by 20-40% in documented deployments — directly reducing demurrage costs that are the single largest variable cost driver in port-intensive supply chains
• The governance gap (78% of companies lack AI accountability clarity in multi-party customs) is both a risk and a competitive opportunity: organizations that build governed AI customs infrastructure are simultaneously reducing regulatory risk and creating a capability that procurement-constrained competitors cannot match
STRATEGIC IMPLICATIONS
• Audit customs classification accuracy against AI reclassification analysis: most organizations find 10-20% of their HS code classifications are defensible but suboptimal — the duty savings from optimization often fund the AI compliance investment entirely
• Implement tiered confidence scoring as the architecture for customs AI: automatic processing for high-confidence classifications, expedited human review for medium confidence, specialist routing for low confidence — this model captures maximum automation while maintaining regulatory compliance
• Address the multi-party AI accountability gap before deploying cross-border AI: define explicitly which party is accountable for AI-generated customs declarations, what the audit trail requirements are, and what the escalation protocol is when AI output is incorrect
Trend #30 — Port, Terminal & Hub AI — The Throughput Bottleneck Intelligently Broken

WHY THIS EXISTS
Port AI is advancing from single-point automation to fully integrated terminal operating systems. Rotterdam, Singapore PSA, Shanghai, and Los Angeles are deploying AI-managed terminal operations. The specific AI capability that matters most: optimization across multiple simultaneous constraints (berth availability, crane capacity, container placement physics, yard truck routing, gate throughput) that is intractable for human dispatchers but tractable for AI in real time. The Red Sea disruption in 2025-2026 has rerouted significant freight to European ports not designed for the volume — creating berth congestion that AI terminal management is better positioned to handle than legacy planning systems. Edge computing is the enabling infrastructure: port AI that processes video, sensor, and tracking data at the terminal edge without cloud roundtrip achieves the sub-100ms response times that real-time crane and vehicle coordination requires.
BUSINESS IMPACT
• Automated port terminals achieve 30-50% higher throughput per berth vs. conventional terminals — the difference in throughput is the difference between a port that can absorb demand surges (Red Sea rerouting, seasonal peaks) and one that cannot
• AI berth planning that accounts for vessel ETA variability, tide constraints, and downstream yard capacity simultaneously — rather than sequentially — reduces average berth waiting time by 20-35%, directly improving vessel utilization for carriers and reducing demurrage for shippers
• Port digital twins (FedEx simulates 14M scenarios daily; equivalent port digital twins are being deployed at major terminals) allow terminal operators to simulate the impact of disruptions before they cascade — identifying optimal responses to vessel delays, equipment failures, and labor actions before they affect the physical operation
STRATEGIC IMPLICATIONS
• Engage with port authority technology programs before selecting port routing strategies: the AI capability of the port (real-time data API, automated systems, digital documentation) determines whether your supply chain can benefit from the throughput improvements AI terminal management delivers
• Build port pre-arrival documentation and AI customs pre-clearance into standard operating procedure: AI-generated pre-clearance reduces dwell time by 20-40%, with the documents submitted before the vessel arrives at berth
• Develop multi-port strategies with documented AI capability thresholds: in the current environment, port technology capability is as important as geographic position and rate — include it as a carrier partner selection criterion
Trend #31 — AI-Orchestrated Warehousing — The Self-Operating Fulfillment Center

WHY THIS EXISTS
The warehouse segment has the most mature and most documented AI deployment of any logistics segment. The architectural insight from Q1 2026 (Logistics Viewpoints): the most competitive warehouses are not the most automated — they are the most aligned, where people, systems, and machines operate from the same real-time playbook. The AI orchestration layer — which coordinates AMRs, autonomous forklifts, goods-to-person systems, and human workers simultaneously — is the strategic differentiator. KNAPP’s KiSoft FCS coordinates robot fleets in real time, distributing orders, optimizing travel paths, and adjusting priorities without human dispatcher intervention. Microsoft’s Azure-KUKA integration cuts robot programming time for simple tasks by 80%. The cobotic model (humans and robots working together) consistently outperforms both pure automation and pure human operation.
BUSINESS IMPACT
• AI orchestration of mixed human-robot warehouses achieves 15-25% higher throughput than either pure automation or pure human operation — the optimal configuration is a cobotic model where AI assigns tasks to the appropriate executor (human or robot) based on task characteristics in real time
• Pick accuracy improvement: human pick accuracy averages 99.5%; AI-orchestrated robot pick accuracy averages 99.99% — a 100x reduction in error rate that directly reduces repack, customer service, and return processing costs at scale
• AI warehouse slotting optimization — continuously repositioning inventory based on demand velocity, pick path efficiency, and replenishment constraints — reduces pick travel distance by 15-30% without any physical infrastructure change
STRATEGIC IMPLICATIONS
• Define the human-robot boundary in your warehouse before selecting automation technology: high-frequency, predictable, physically demanding tasks are the AMR opportunity; irregular products, exception handling, and customer-facing tasks are the human opportunity — the boundary definition drives the technology specification
• Invest in the AI orchestration layer before the physical robots: the software that coordinates fleets is where the operational intelligence lives — the robot hardware is commoditizing while the orchestration capability is differentiating
• Measure warehouse AI in commercial terms: cost per order picked, error rate per thousand orders, throughput per square foot — not robot utilization rate or deployment count
Trend #32 — Last-Mile Intelligence — From Route Planning to Hyper-Local Delivery Networks
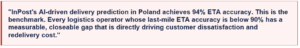
WHY THIS EXISTS
Last-mile delivery represents 30-53% of total supply chain cost (Gartner/Capgemini) and is simultaneously the highest customer-visibility stage and the most labor-intensive, least efficient segment. AI in last-mile is advancing from route optimization (making the existing model more efficient) to hyper-local network redesign (repositioning inventory and delivery capacity based on AI demand prediction to make the model structurally more efficient). Ziegler Group describes the 2026 shift: “Micro-fulfillment centers and urban dark stores use AI to position high-demand products closer to consumers, reducing both lead times and emissions.” InPost’s 94% ETA accuracy sets the competitive standard. Drone delivery achieving EUR 1.20-2.50 per delivery vs. EUR 4-8 for human last-mile is the economics benchmark. The AI-first last-mile model uses predictive positioning (stocking urban delivery hubs based on 72-hour demand predictions), dynamic routing (adjusting sequences in real time as deliveries complete and new orders arrive), and autonomous delivery (drones and ground robots in defined operating envelopes).
BUSINESS IMPACT
• Predictive inventory positioning in micro-fulfillment centers — stocking urban hubs 72 hours ahead of demand based on AI prediction — reduces same-day fulfillment cost by 20-35% vs. reactive replenishment from central distribution
• Dynamic route optimization that adjusts delivery sequences in real time (as deliveries complete, customer availability changes, and new orders arrive) improves on-time delivery rates by 10-18% vs. static morning-dispatch routing
• Drone delivery economics at EUR 1.20-2.50 per delivery vs. EUR 4-8 for human last-mile creates a 2-5x cost advantage in the specific operating contexts where drone delivery is viable — rural and suburban low-density routes, healthcare urgent delivery, and high-value parcel delivery
STRATEGIC IMPLICATIONS
• Audit last-mile ETA accuracy: InPost’s 94% is the 2026 benchmark — organizations below 85% accuracy have a customer satisfaction and redelivery cost problem that AI dynamic ETA prediction directly addresses
• Evaluate micro-fulfillment center economics for your highest-density urban markets: the AI-optimized MFC reduces last-mile distance, last-mile cost, and last-mile emissions simultaneously — the economics improve further with CBAM carbon pricing
• Design customer communication as an AI capability, not an afterthought: the last-mile customer experience is dominated by the communication (when will it arrive, what are my options, what happened to my delivery) — AI that handles this communication at scale and with personalization directly improves NPS and reduces inbound customer service volume
Investment Sequencing: The Mandatory Build Order

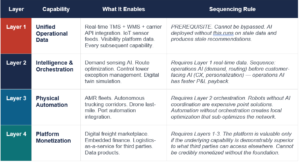

The Logistics Intelligence Platform P&L: What the Transformation Looks Like in Financial Terms
The operating model choice between Asset Operator and Intelligence Platform is not a strategic framing — it is a P&L architecture choice. The following illustrative model for a $10B revenue logistics operator shows what the income statement looks like under each model. Numbers are based on disclosed operator financials, McKinsey platform economics benchmarks, and industry composite data.
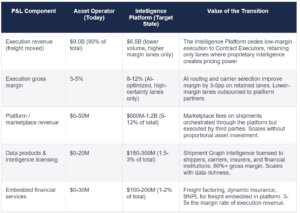
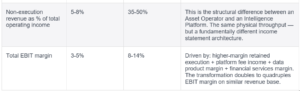
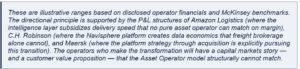
AI Maturity Model: Four Observable Stages of Logistics Transformation

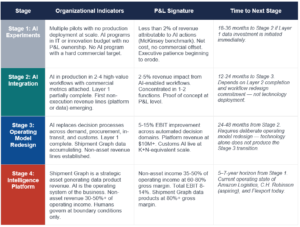
The AI-First Operator Profiles: What the Challenging Model Looks Like at Scale

Amazon Logistics
ARCHITECTURE
AI-first from inception. Demand intelligence drives everything: which products are stocked where, which carrier is selected for which delivery, which route sequence is optimal, which exceptions are handled autonomously. The physical network is deployed to serve AI-determined outcomes.
SHIPMENT GRAPH
The most complete consumer-demand-to-last-mile Shipment Graph in existence. Every delivery outcome — ETA accuracy, customer response, route efficiency, carrier performance — trains the model. Amazon Logistics AI improves with every order placed on Amazon.com.

• Amazon Annual Report 2025 · Amazon Robotics — 750,000+ robots in operation · MCF third-party expansion confirmed in Amazon press releases
C.H. Robinson (Navisphere)
ARCHITECTURE
Technology platform first, asset-light freight brokerage second. Navisphere processes 18 million+ shipments annually across 200,000+ carriers. AI pricing and carrier matching operate at the transaction level. The intelligence layer is the product; execution is a service delivered through the platform.
SHIPMENT GRAPH
18 million shipments annually = 18 million Shipment Graph data points. Every transaction enriches a pricing model that every individual carrier or shipper operating in any of those lanes cannot replicate from their own data. The data density compounds with every year of platform operation.

• C.H. Robinson Annual Report 2025 · Navisphere platform data · ARC Advisory Logistics Intelligence 2026
Flexport
ARCHITECTURE
Technology-native freight forwarder with AI-powered customs, documentation, and visibility as core capabilities. Post-Shopify Logistics acquisition adds physical fulfillment capability to the intelligence platform — following the same integration logic as Amazon (technology first, physical assets to serve AI conclusions).
SHIPMENT GRAPH
Building a cross-modal Shipment Graph. AI customs platform processing declarations at scale. Real-time visibility data from the platform continuously enriches predictive models for clearance times, transit delays, and carrier reliability.

• Flexport press releases 2025-2026 · Shopify Logistics acquisition · ARC Advisory · Supply & Demand Chain Executive February 2026
The Logistics Regulatory Timeline: What Is Mandatory, When, and What It Requires
The regulatory forcing functions acting on global logistics in 2026 are not theoretical. CBAM entered definitive force January 1, 2026. The EU AI Act provisions applying to logistics AI systems are active. The GS1 Sunrise 2027 deadline is 18 months away. Each represents a non-negotiable compliance requirement with specific data infrastructure, process, and technology implications.
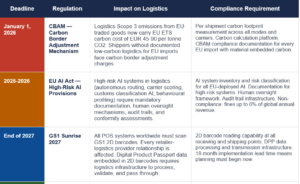
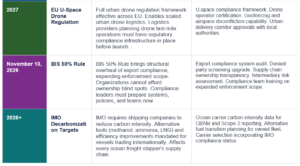
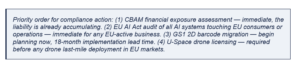
M&A Intelligence: The Consolidation Logic and What the Deal Flow Signals
The M&A activity in global logistics is not driven by traditional synergy logic — route overlap reduction, shared services consolidation, and procurement leverage. It is driven by the Shipment Graph logic: the more freight data an operator sees, the better its AI, the more valuable its intelligence platform, and the higher the premium it can command from customers and from capital markets. Every major acquisition in this analysis is a Shipment Graph expansion strategy.
DSV + DB Schenker (€14.3B, 2024)
ACQUISITION LOGIC
Largest logistics acquisition in history. Scale bet: the combined DSV/Schenker entity sees the largest European freight network, with data density to build a Shipment Graph that no standalone European operator can match. Integration challenge: 140,000+ combined employees, two TMS platforms, two distinct operating cultures.

CMA CGM + CEVA Logistics (ongoing)
ACQUISITION LOGIC
Ocean carrier integrating contract logistics to build end-to-end capability. Control of physical assets from factory to door. Competing directly with Maersk’s integrated logistics strategy — both major ocean carriers are explicitly exiting the pure asset model.

Maersk + Multiple (Pilots, Senator, LF Logistics, Visible SCM, $10B+, 2019-2025)
ACQUISITION LOGIC
Systematic acquisition of freight forwarding, customs brokerage, contract logistics, and air freight capability. Building the end-to-end service stack of an integrated logistics provider from an ocean carrier base. The most documented case of an incumbent deliberately redesigning its business model.
UPS + Healthcare Assets (multiple, 2023-2025)
ACQUISITION LOGIC
UPS Healthcare division building specialist cold chain capability in the highest-margin logistics segment. Healthcare cold chain is a defensible niche: regulatory complexity, temperature sensitivity, and liability exposure create barriers that commodity freight operators cannot overcome.

Flexport + Shopify Logistics (2023)
ACQUISITION LOGIC
Technology-native freight forwarder acquiring e-commerce fulfillment capability. Integrating intelligence platform with physical distribution. Ryan Petersen’s return signals recommitment to the full-stack Intelligence Platform model.

Aurora + NVIDIA + FedEx Partnership
ACQUISITION LOGIC
Autonomous trucking startup backed by semiconductor and logistics giants. FedEx’s partnership signals incumbent desire to integrate autonomous trucking capability before it disrupts the network from outside.

Conclusion: The Five Strategic Choices That Determine Competitive Position Through 2030

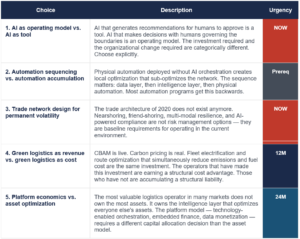

The Four Destination States: Which One Are You Building Toward?
Every logistics operator reading this analysis is — whether explicitly or not — on a path to one of four destination states. The destination is not determined by aspiration. It is determined by capital allocation, technology investment, and organizational operating model over the next 24 months. Name your destination explicitly, because the decisions required to reach each one are mutually exclusive.
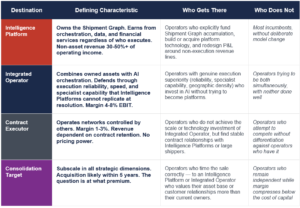
Conclusion
“Logistics is not competing on rates anymore. It is competing for control of the Shipment Graph —the intelligence layer that sees all freight, trains AI on market data, and earns from orchestration regardless of who owns the physical asset.”
The convergence of these seven forces — across eight value chain segments — will resolve into four distinct competitive positions. The critical variable is not which forces are acting on you. Every logistics operator faces the same seven forces. The critical variable is whether your organization is building the Shipment Graph, redesigning its operating model around AI, and sequencing its investments in the mandatory build order.
Leave a Reply